Open Access
Fig. 2
Download original image
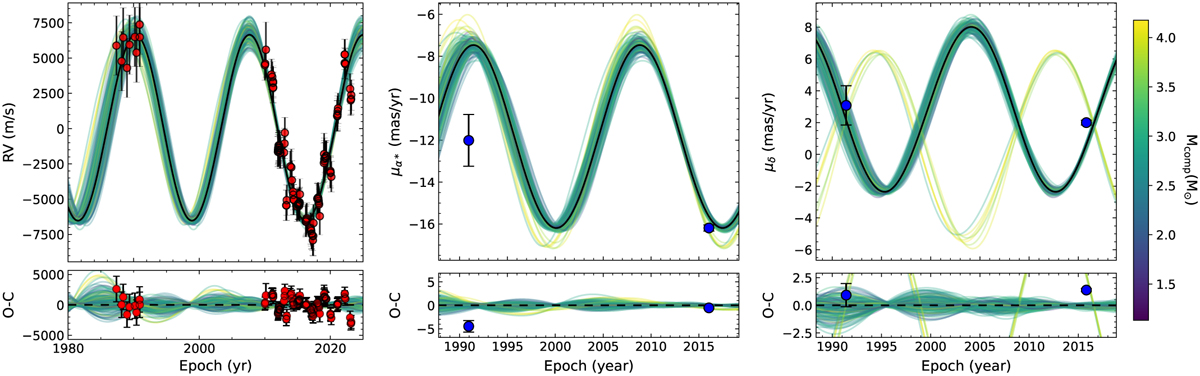
ORVARA results: RV curve (left), proper motions in right ascension (centre) and declination (right). In all plots, the black thick line represents the best-fitting orbit, while 40 other well-fitting orbits are included and colour-coded as a function of the companion mass.
Current usage metrics show cumulative count of Article Views (full-text article views including HTML views, PDF and ePub downloads, according to the available data) and Abstracts Views on Vision4Press platform.
Data correspond to usage on the plateform after 2015. The current usage metrics is available 48-96 hours after online publication and is updated daily on week days.
Initial download of the metrics may take a while.