Fig. 11
Download original image
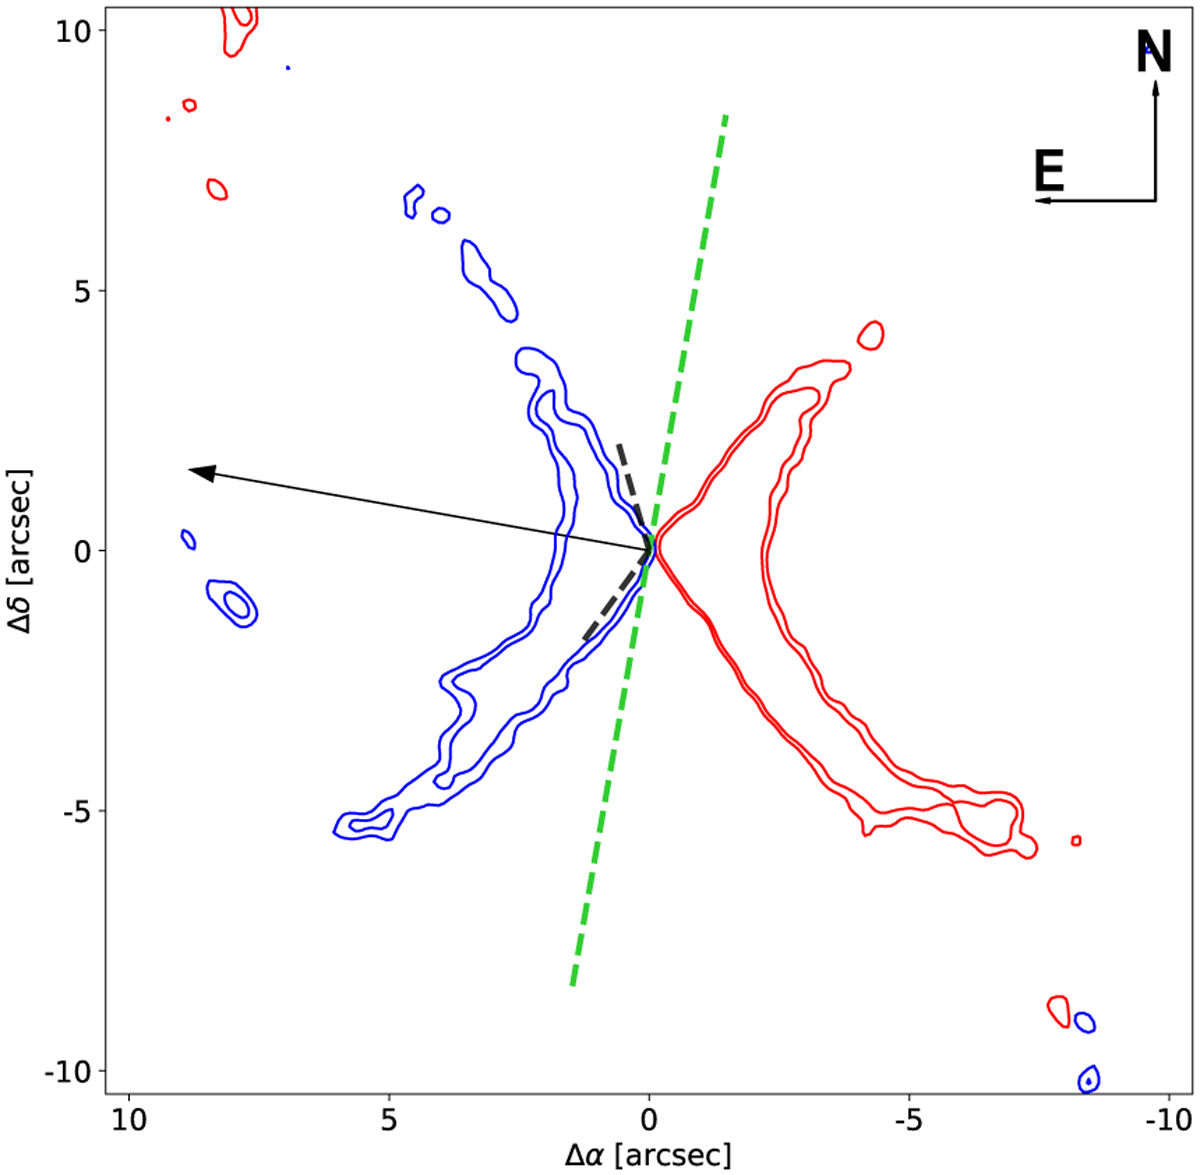
Sky-projected system orientation compared to radio observation. The contour levels is a stereogram view of the 12CO J = 2−1 high-velocity emission. The contour levels are drawn at 6, 8, and 10 mJy beam−1 for two maps equally shifted by ±100 km s−1 from the centre-of-mass velocity. The blue-shifted contours are displayed in blue, and the red-shifted in red. The dashed green line represents the orbital line of node, the black arrow the jet axis and the dashed black line sketches the cone edges.
Current usage metrics show cumulative count of Article Views (full-text article views including HTML views, PDF and ePub downloads, according to the available data) and Abstracts Views on Vision4Press platform.
Data correspond to usage on the plateform after 2015. The current usage metrics is available 48-96 hours after online publication and is updated daily on week days.
Initial download of the metrics may take a while.