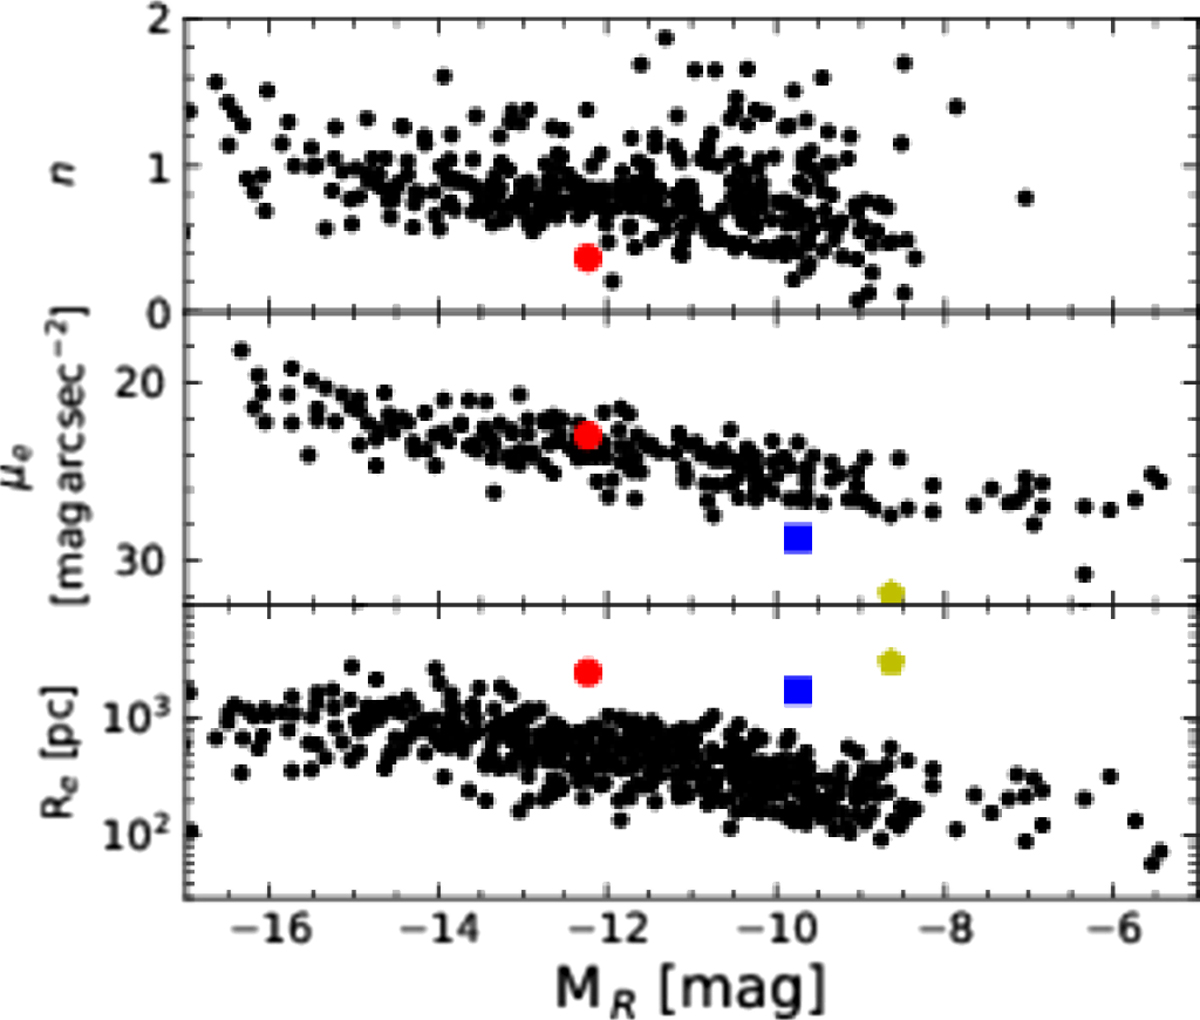
Fig. 8.
Download original image
Location of Pelops (red point) on the magnitude-radius plot (bottom panel) and in relation to the surface brightness at the effective radius (middle panel) and the Sersic-index (top panel). Data from dwarf galaxies in various groups and clusters are shown as black points (Chiboucas et al. 2009; Müller et al. 2015; McConnachie 2012; Muñoz et al. 2015; Park et al. 2017; Byun et al. 2020). Indicated in blue and green are the dwarf spheroidals And XIX and Antlia 2, which are the most extended objects in the Local Group.
Current usage metrics show cumulative count of Article Views (full-text article views including HTML views, PDF and ePub downloads, according to the available data) and Abstracts Views on Vision4Press platform.
Data correspond to usage on the plateform after 2015. The current usage metrics is available 48-96 hours after online publication and is updated daily on week days.
Initial download of the metrics may take a while.