Fig. 2
Download original image
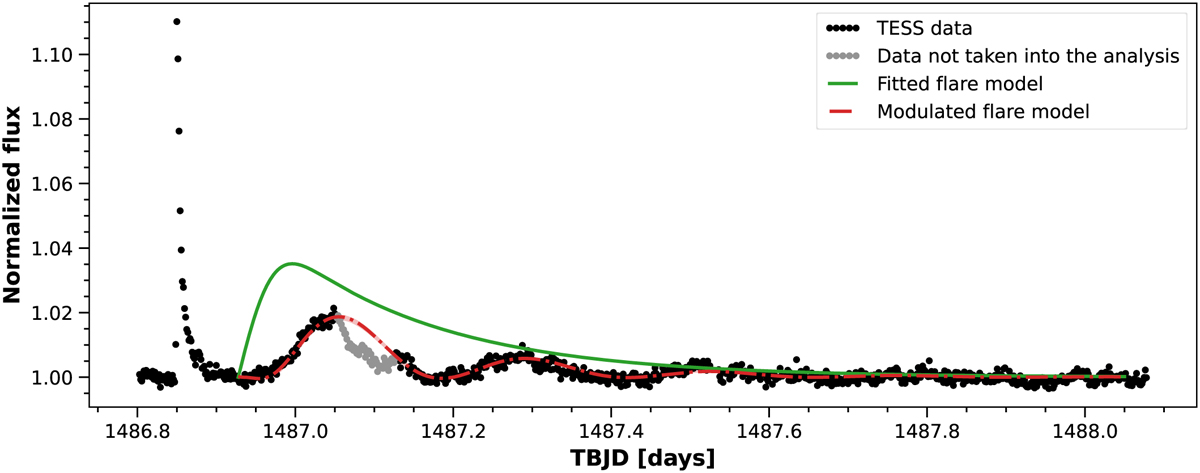
Part of the TESS light curve from sector 6 corrected to the variability caused by stellar spots. The red curve and red interval mark the modulated flare model and the fit error, respectively. The green curve shows the recreated course of the stellar flare without the effects of foreshortening or stellar rotation. The gray points mark the data not used in the analysis. The translucent red area presents the uncertainty area.
Current usage metrics show cumulative count of Article Views (full-text article views including HTML views, PDF and ePub downloads, according to the available data) and Abstracts Views on Vision4Press platform.
Data correspond to usage on the plateform after 2015. The current usage metrics is available 48-96 hours after online publication and is updated daily on week days.
Initial download of the metrics may take a while.