Fig. 9.
Download original image
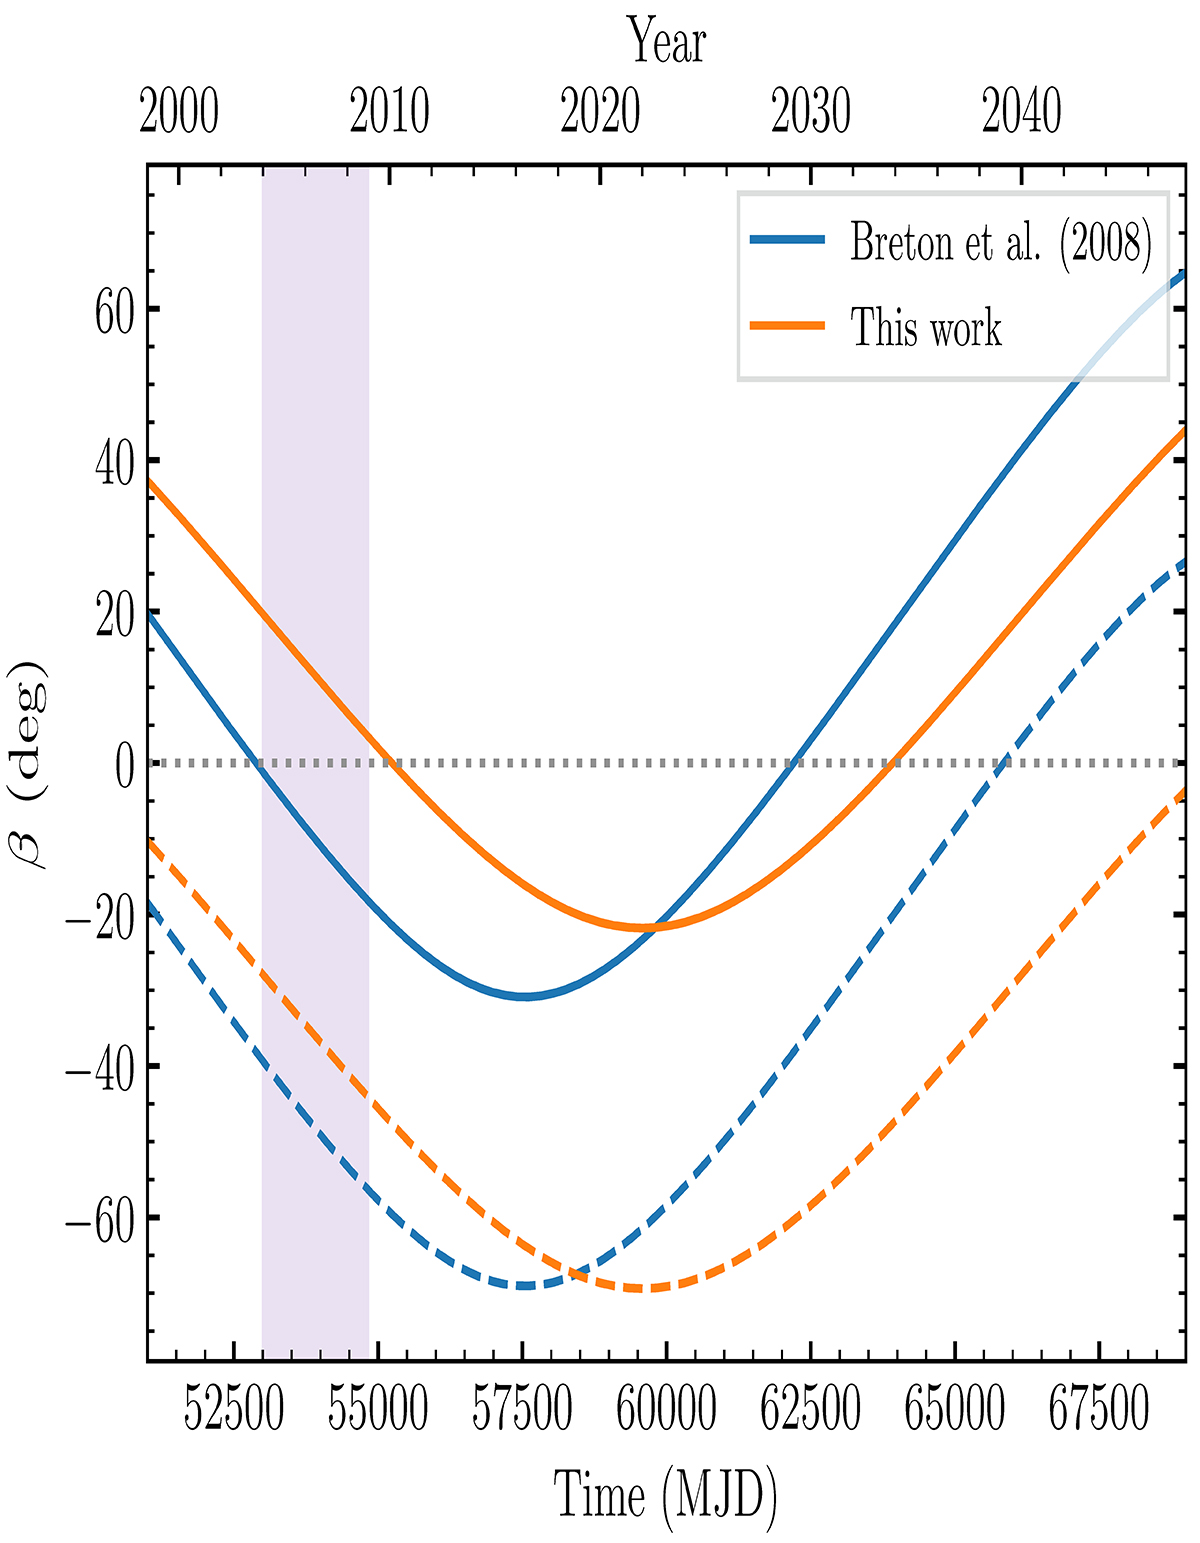
Predicted change in the impact parameter between the magnetic axis of pulsar B and our line of sight over time. Solid lines indicate the ‘active’ beam that was detected in from 2003–2008, dashed lines correspond to the opposite magnetic pole. The vertical shaded region indicates the time-span over which radio pulses were detected from pulsar B.
Current usage metrics show cumulative count of Article Views (full-text article views including HTML views, PDF and ePub downloads, according to the available data) and Abstracts Views on Vision4Press platform.
Data correspond to usage on the plateform after 2015. The current usage metrics is available 48-96 hours after online publication and is updated daily on week days.
Initial download of the metrics may take a while.