Fig. 7.
Download original image
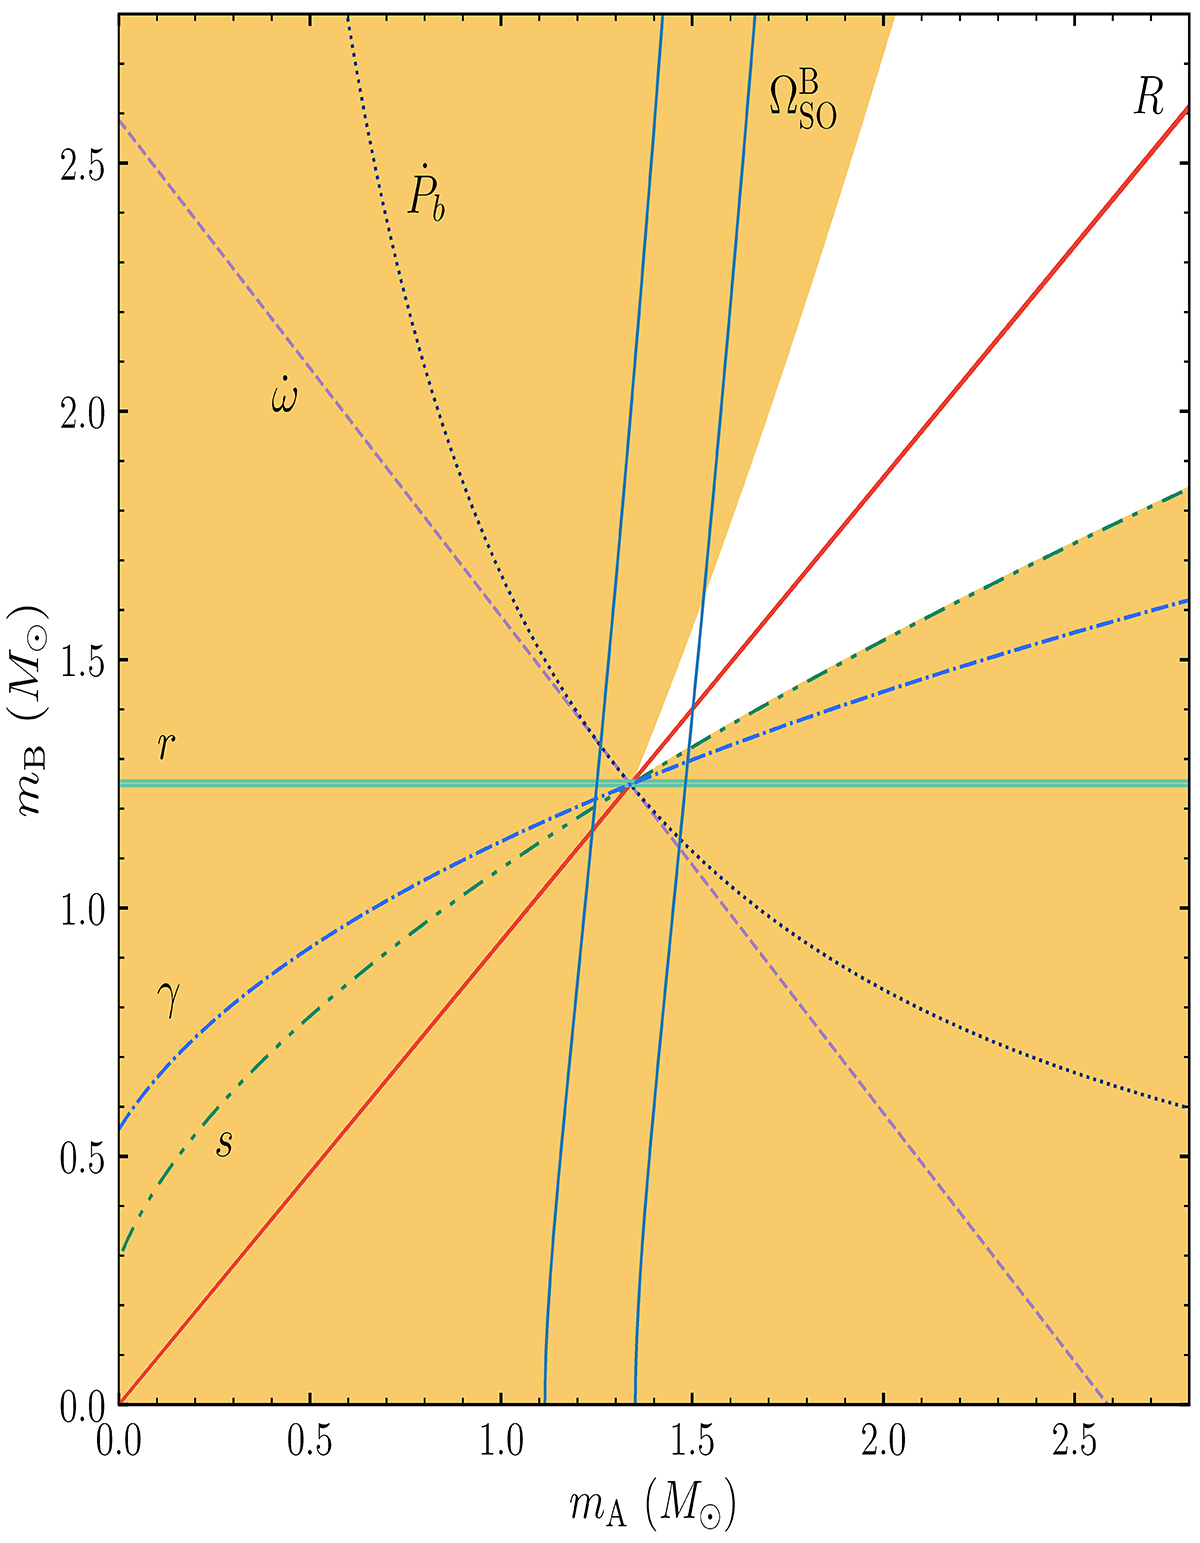
Mass-mass diagram illustrating current tests of general relativity with the double pulsar. Our improved measurement of pulsar B’s spin-precession rate (![]() ) is given by the (mostly) vertical blue lines where the separation between them indicates the 68% uncertainty. Other individual constraints on the masses of pulsar A and B from Kramer et al. (2006, 2021a) are shown by pairs of lines. These include the periastron precession rate (
) is given by the (mostly) vertical blue lines where the separation between them indicates the 68% uncertainty. Other individual constraints on the masses of pulsar A and B from Kramer et al. (2006, 2021a) are shown by pairs of lines. These include the periastron precession rate (![]() ), shrinking of the orbital period due to gravitational radiation (Ṗb), gravitational redshift (γ), Shapiro delay range (r) and shape (s), and the mass-ratio (R). The shaded region is forbidden by the individual mass functions of the two pulsars (i.e. sin i ≤ 1).
), shrinking of the orbital period due to gravitational radiation (Ṗb), gravitational redshift (γ), Shapiro delay range (r) and shape (s), and the mass-ratio (R). The shaded region is forbidden by the individual mass functions of the two pulsars (i.e. sin i ≤ 1).
Current usage metrics show cumulative count of Article Views (full-text article views including HTML views, PDF and ePub downloads, according to the available data) and Abstracts Views on Vision4Press platform.
Data correspond to usage on the plateform after 2015. The current usage metrics is available 48-96 hours after online publication and is updated daily on week days.
Initial download of the metrics may take a while.