Fig. 6.
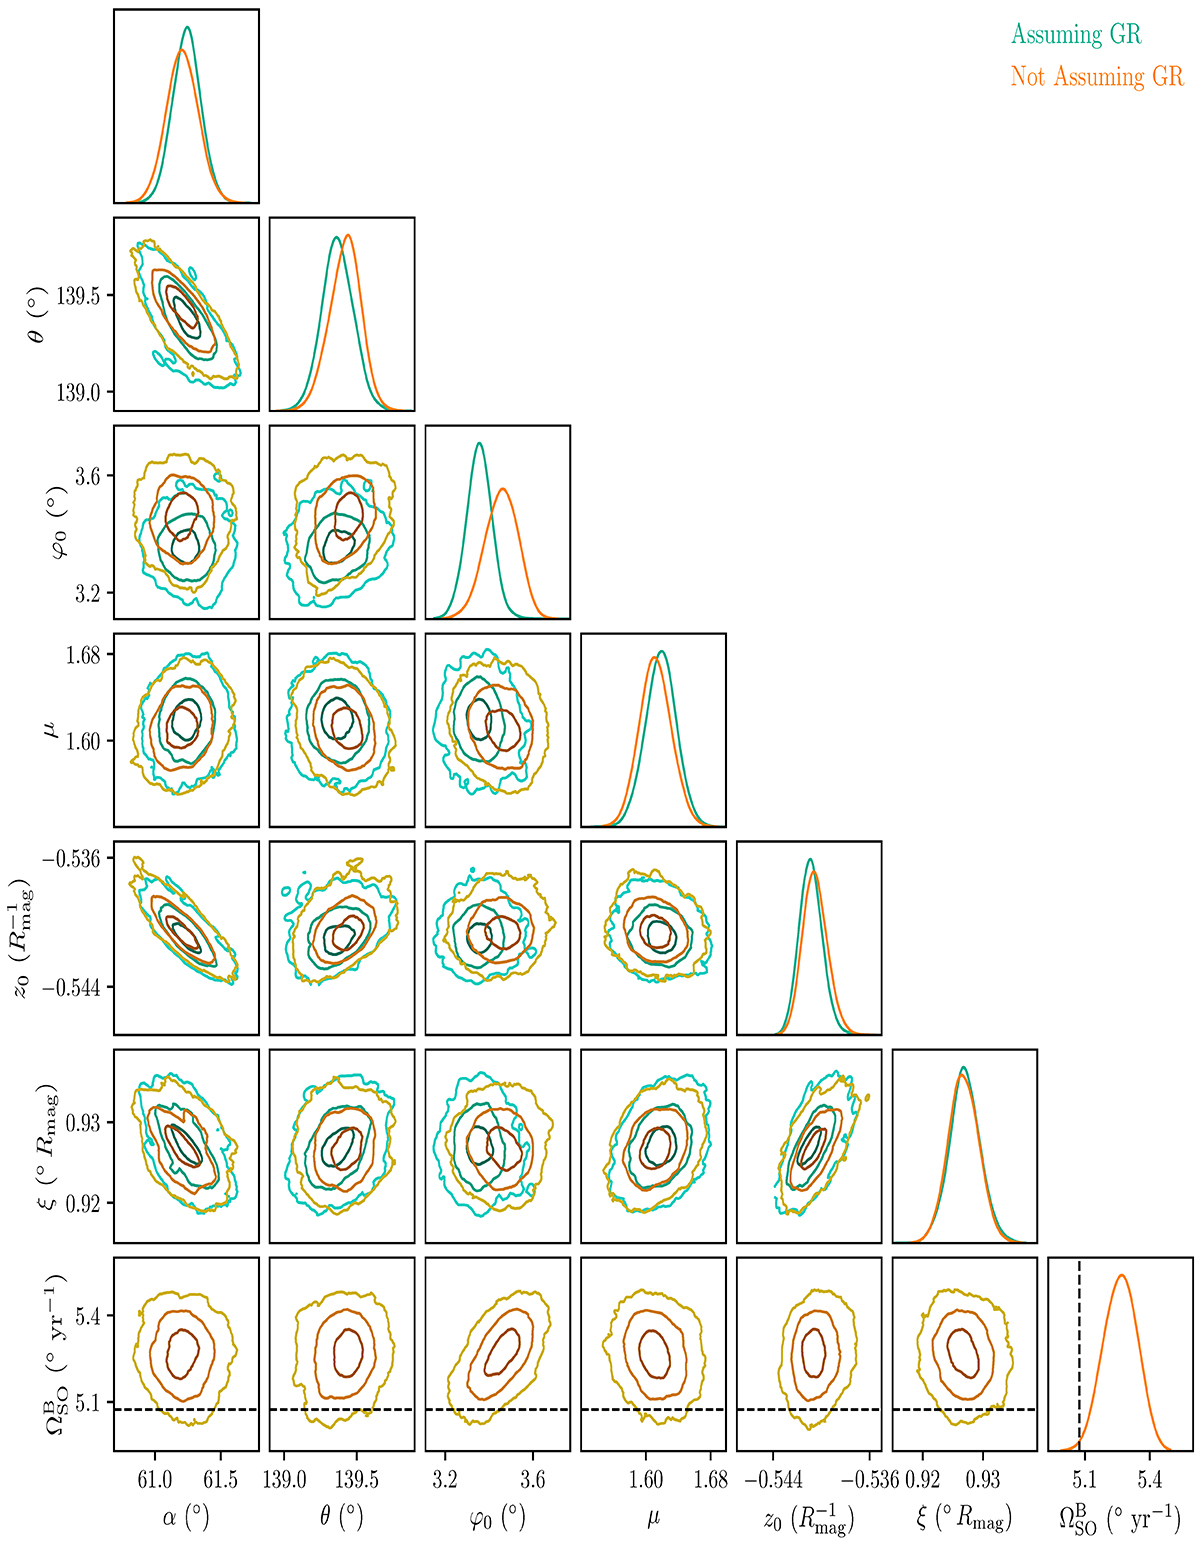
Download original image
One- and two-dimensional posterior distributions of the eclipse light-curve parameters from iteratively fitting the FULLBAND data with the ±0.72° cuts where the precession rate was either fixed to the GR predicted value (green) or allowed to be fit as a free parameter (orange). Contours indicate the 68, 95 and 99.7% confidence intervals. Dashed black line is the predicted value of ![]() .
.
Current usage metrics show cumulative count of Article Views (full-text article views including HTML views, PDF and ePub downloads, according to the available data) and Abstracts Views on Vision4Press platform.
Data correspond to usage on the plateform after 2015. The current usage metrics is available 48-96 hours after online publication and is updated daily on week days.
Initial download of the metrics may take a while.