Fig. 4.
Download original image
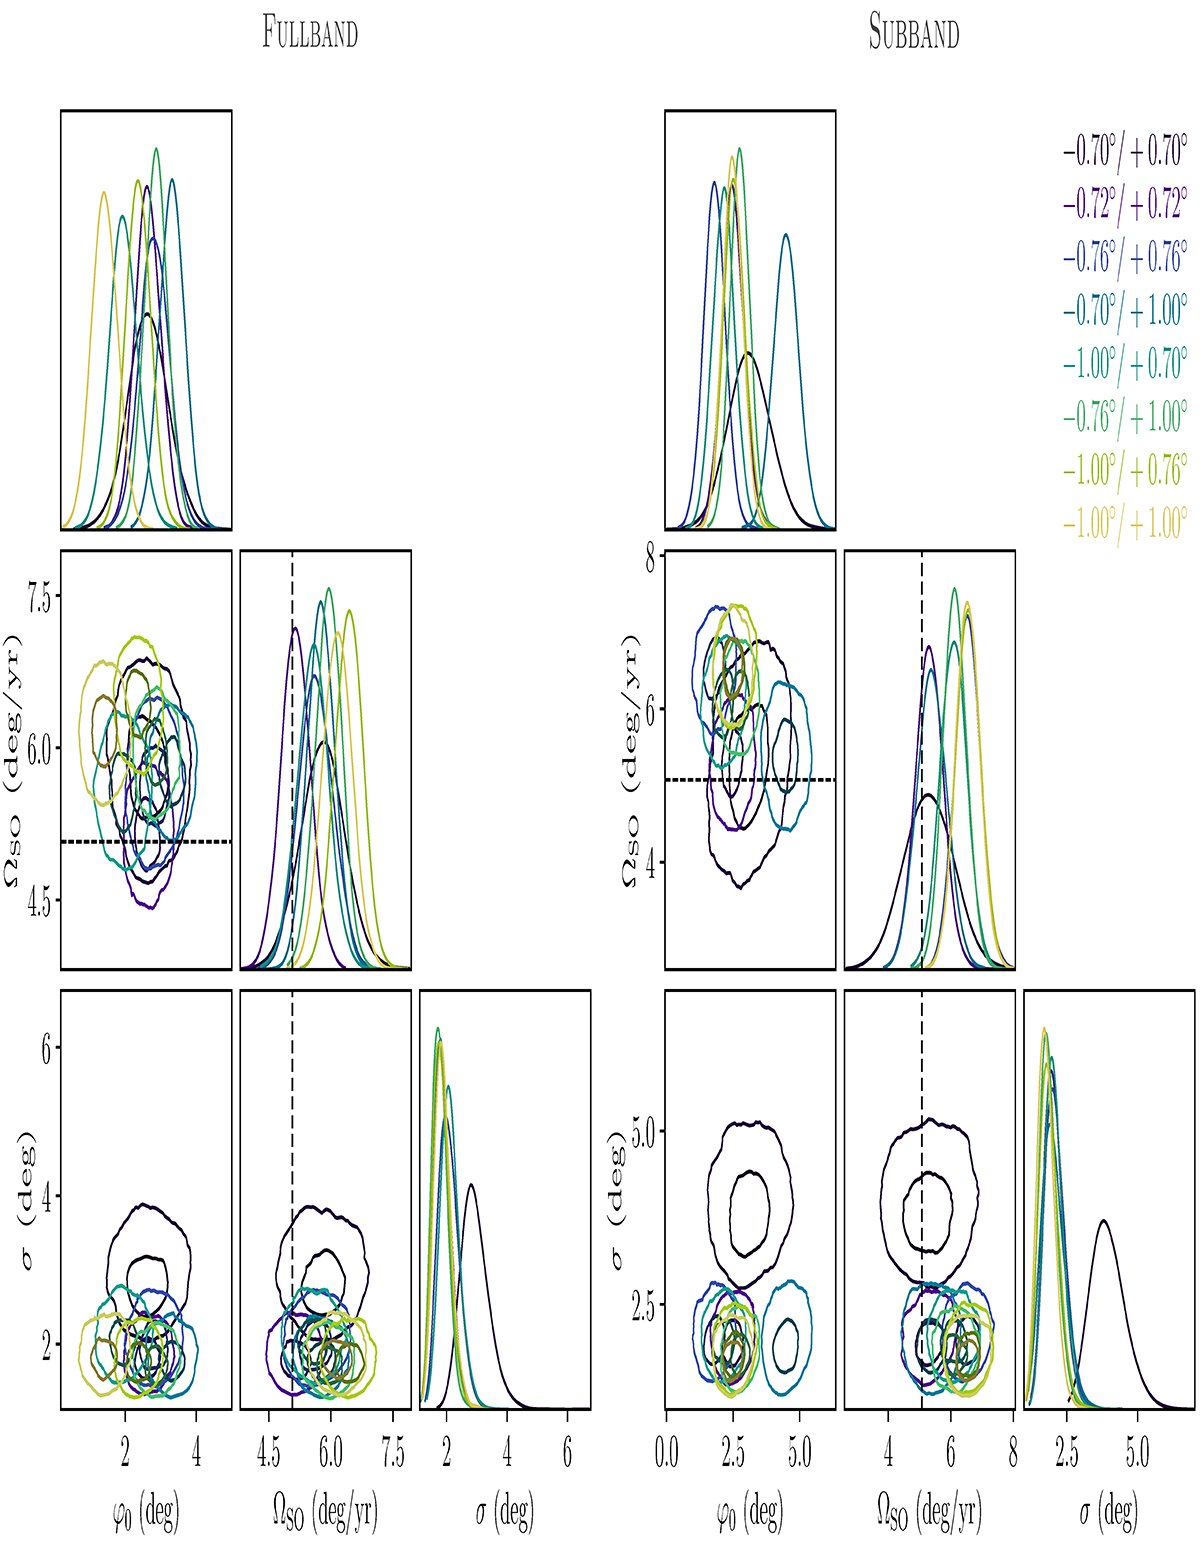
Comparison between hierarchical fits to different realisations of the light curves using the FULLBAND and SUBBAND datasets. Contours in the two-dimensional posteriors represent the 68% and 95% confidence regions. Each colour represents measurements from eclipses that had different amounts of the ingress or egress phases removed. The dashed lines correspond to the predicted values of ![]() from general relativity.
from general relativity.
Current usage metrics show cumulative count of Article Views (full-text article views including HTML views, PDF and ePub downloads, according to the available data) and Abstracts Views on Vision4Press platform.
Data correspond to usage on the plateform after 2015. The current usage metrics is available 48-96 hours after online publication and is updated daily on week days.
Initial download of the metrics may take a while.