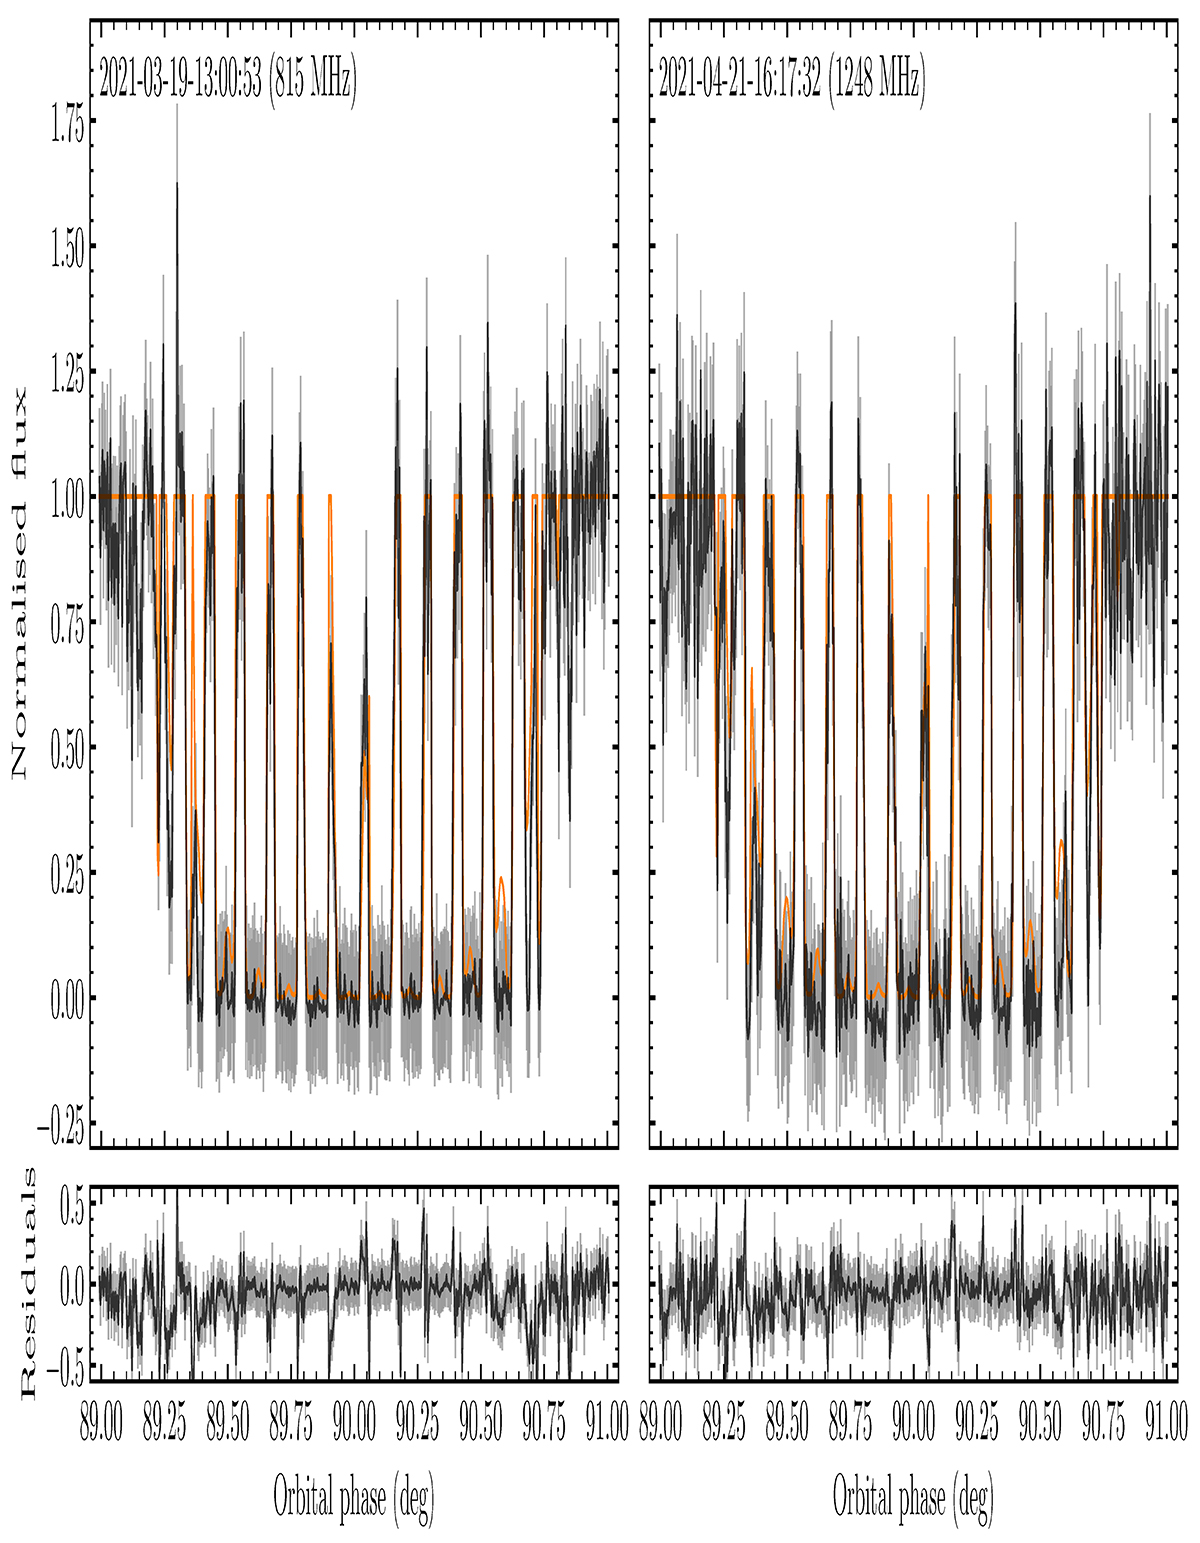
Fig. 3.
Download original image
Two eclipses of pulsar A detected with MeerKAT using the UHF (left) and L-band (right) receiver systems. These light curves were generated after averaging over the full receiver bandpasses. We have inflated the flux uncertainties by the median recovered EQUAD for each eclipse. The orange traces correspond to the median a posteriori light-curve models recovered from fitting the observations. Bottom panels show the residuals after subtracting the median model.
Current usage metrics show cumulative count of Article Views (full-text article views including HTML views, PDF and ePub downloads, according to the available data) and Abstracts Views on Vision4Press platform.
Data correspond to usage on the plateform after 2015. The current usage metrics is available 48-96 hours after online publication and is updated daily on week days.
Initial download of the metrics may take a while.