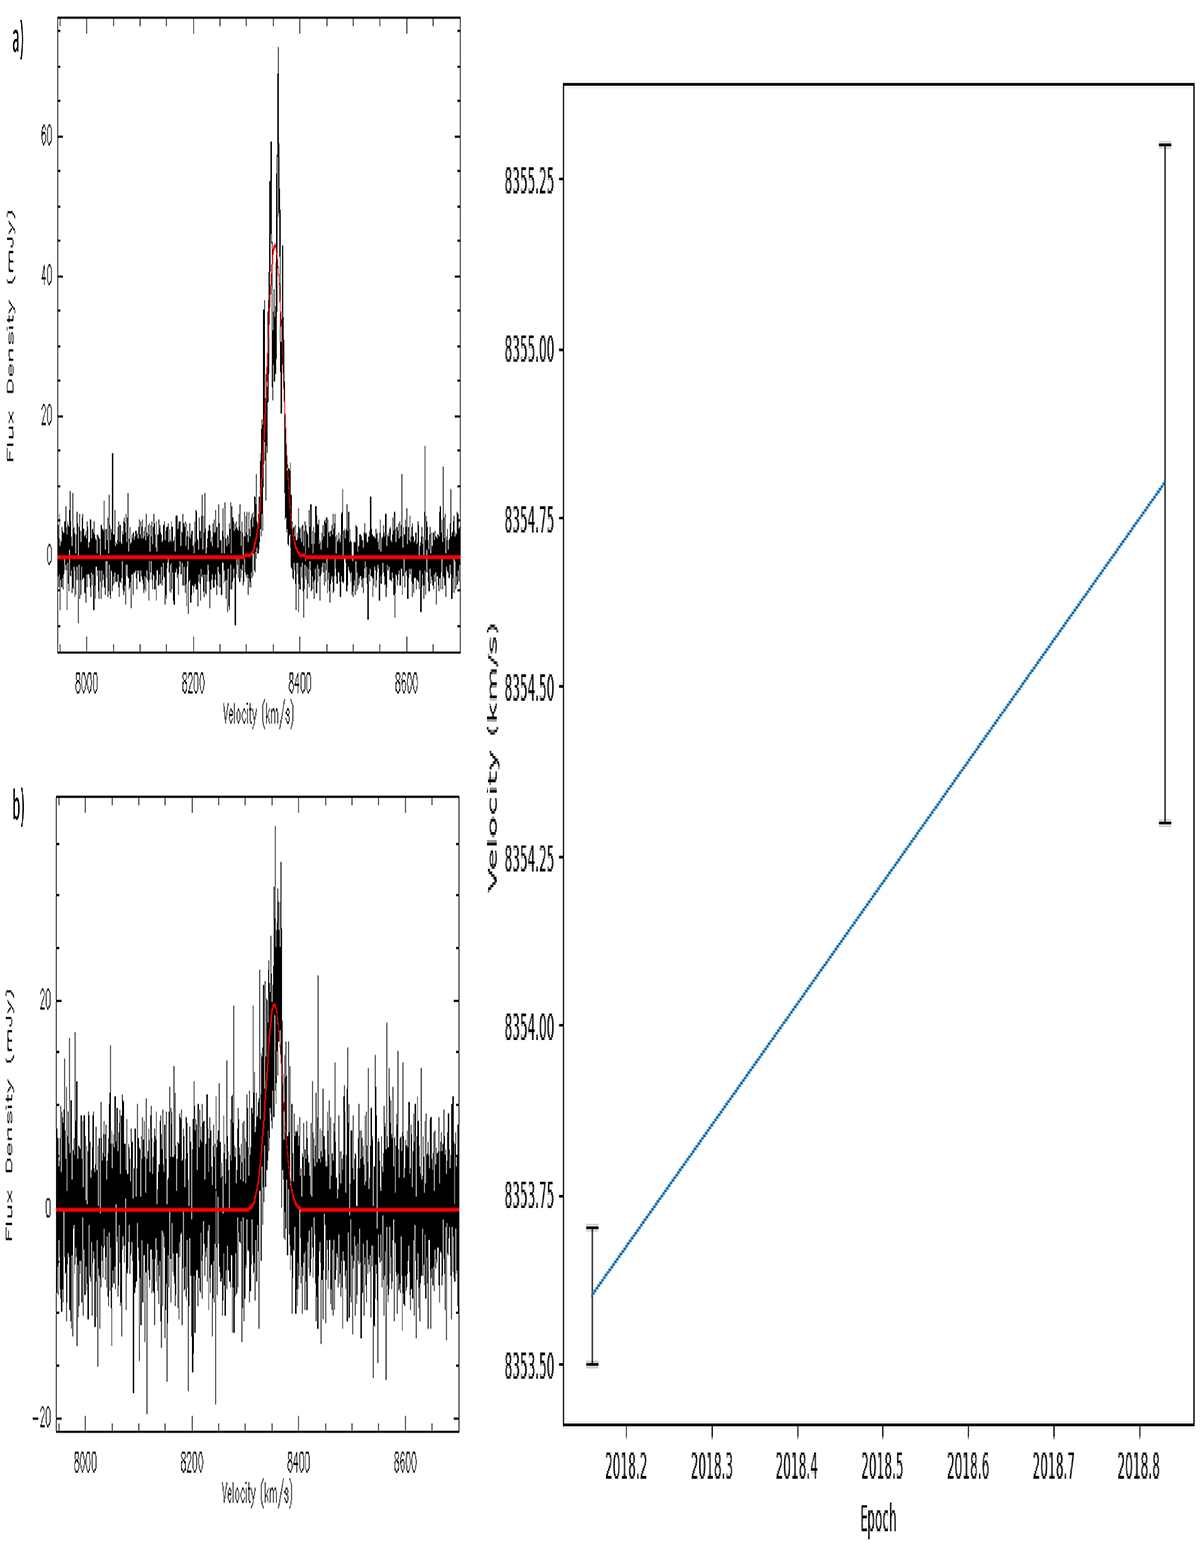
Fig. 8.
Download original image
Spectra and plots of velocity drift. Left panel: spectra of the main maser component M1 in (a) epoch 2018.16 and in (b) epoch 2018.83, with the Gaussian fit (thin red line) used to estimate the velocity drift. Right panel: velocity–epoch diagram. Here, we show the positions in velocity of M1 observed in the two VLBA epochs with the corresponding error bar derived by the Gaussian fit.
Current usage metrics show cumulative count of Article Views (full-text article views including HTML views, PDF and ePub downloads, according to the available data) and Abstracts Views on Vision4Press platform.
Data correspond to usage on the plateform after 2015. The current usage metrics is available 48-96 hours after online publication and is updated daily on week days.
Initial download of the metrics may take a while.