Fig. 5.
Download original image
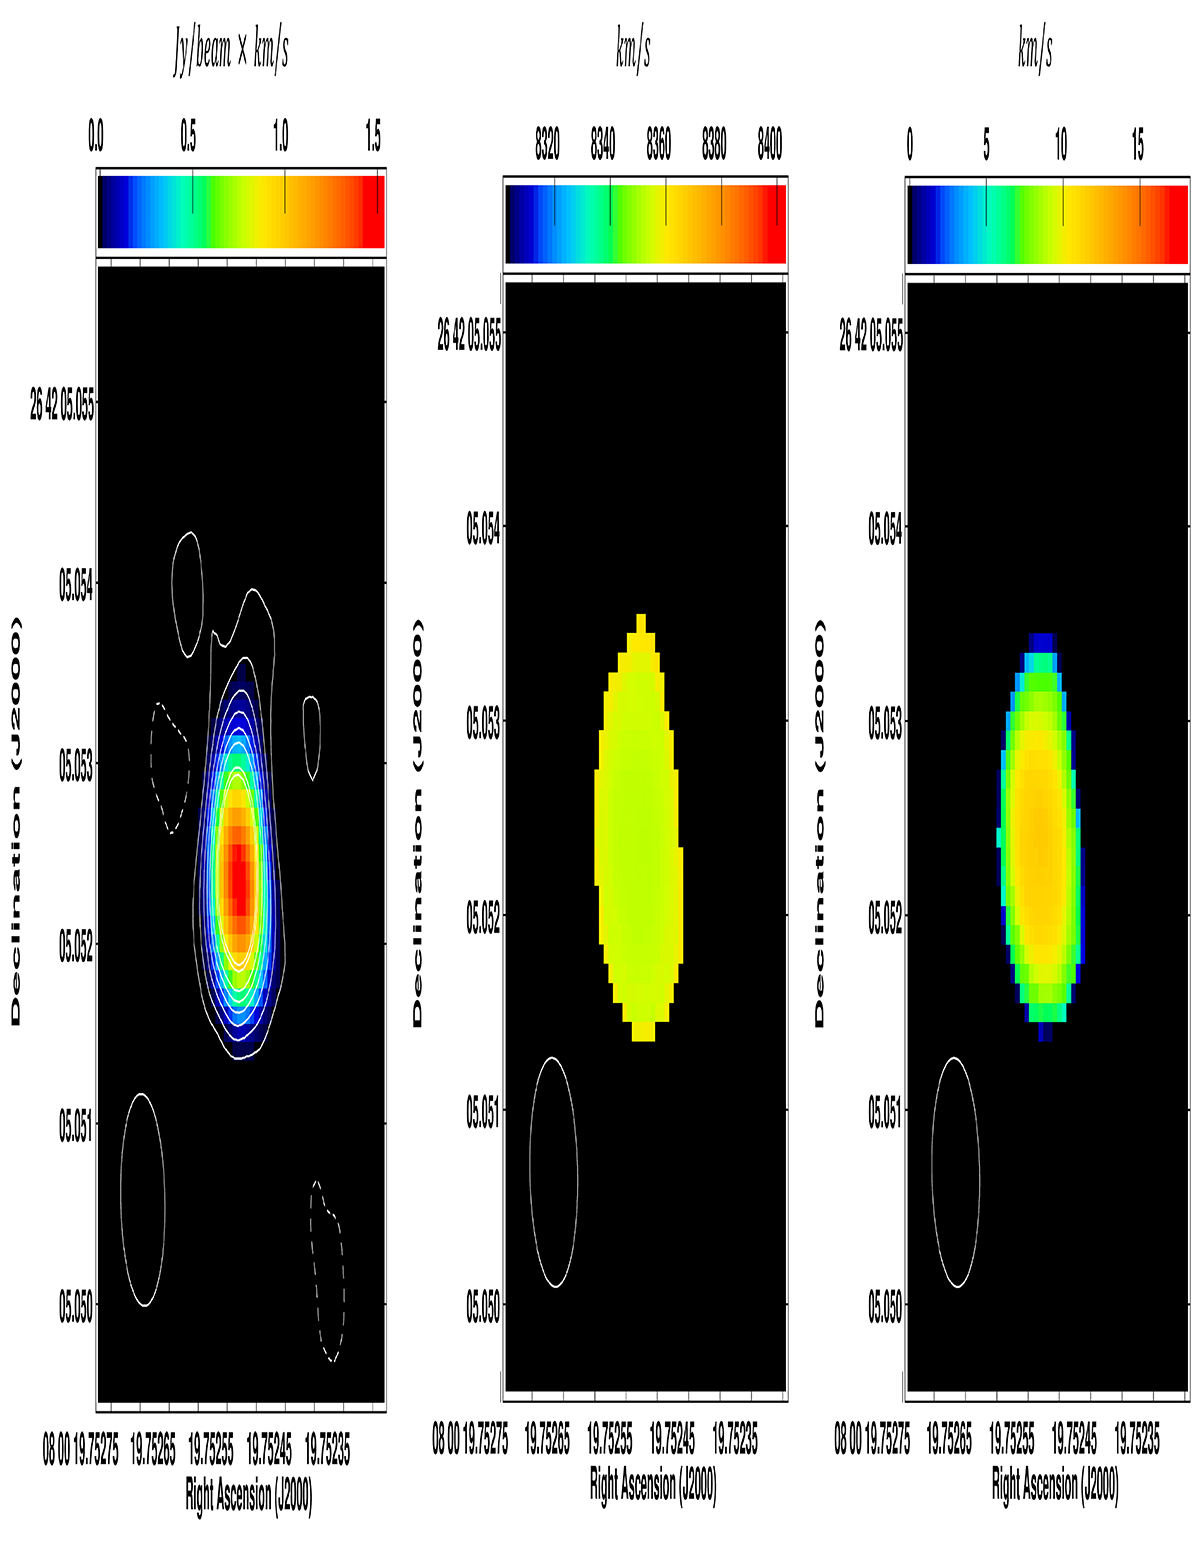
Maps of the zeroth, first, and second moments. Left panel: moment-zero map (colour scale) of the water maser emission in IC 485 superimposed on the sqashed image (contours). Contour levels are: (−3, 3, 6, 9, 12, 15, 24, 26) × 64 μJy beam−1 (1σ rms = 64 μJy beam−1). Centre panel: mean velocity (first moment) map. Right panel: velocity dispersion (second moment) map. These figures were obtained from the epoch VLBA 2018.16. The beam size of (1.16 × 1.02) mas is reported in the bottom left corner of each panel.
Current usage metrics show cumulative count of Article Views (full-text article views including HTML views, PDF and ePub downloads, according to the available data) and Abstracts Views on Vision4Press platform.
Data correspond to usage on the plateform after 2015. The current usage metrics is available 48-96 hours after online publication and is updated daily on week days.
Initial download of the metrics may take a while.