Open Access
Fig. 1.
Download original image
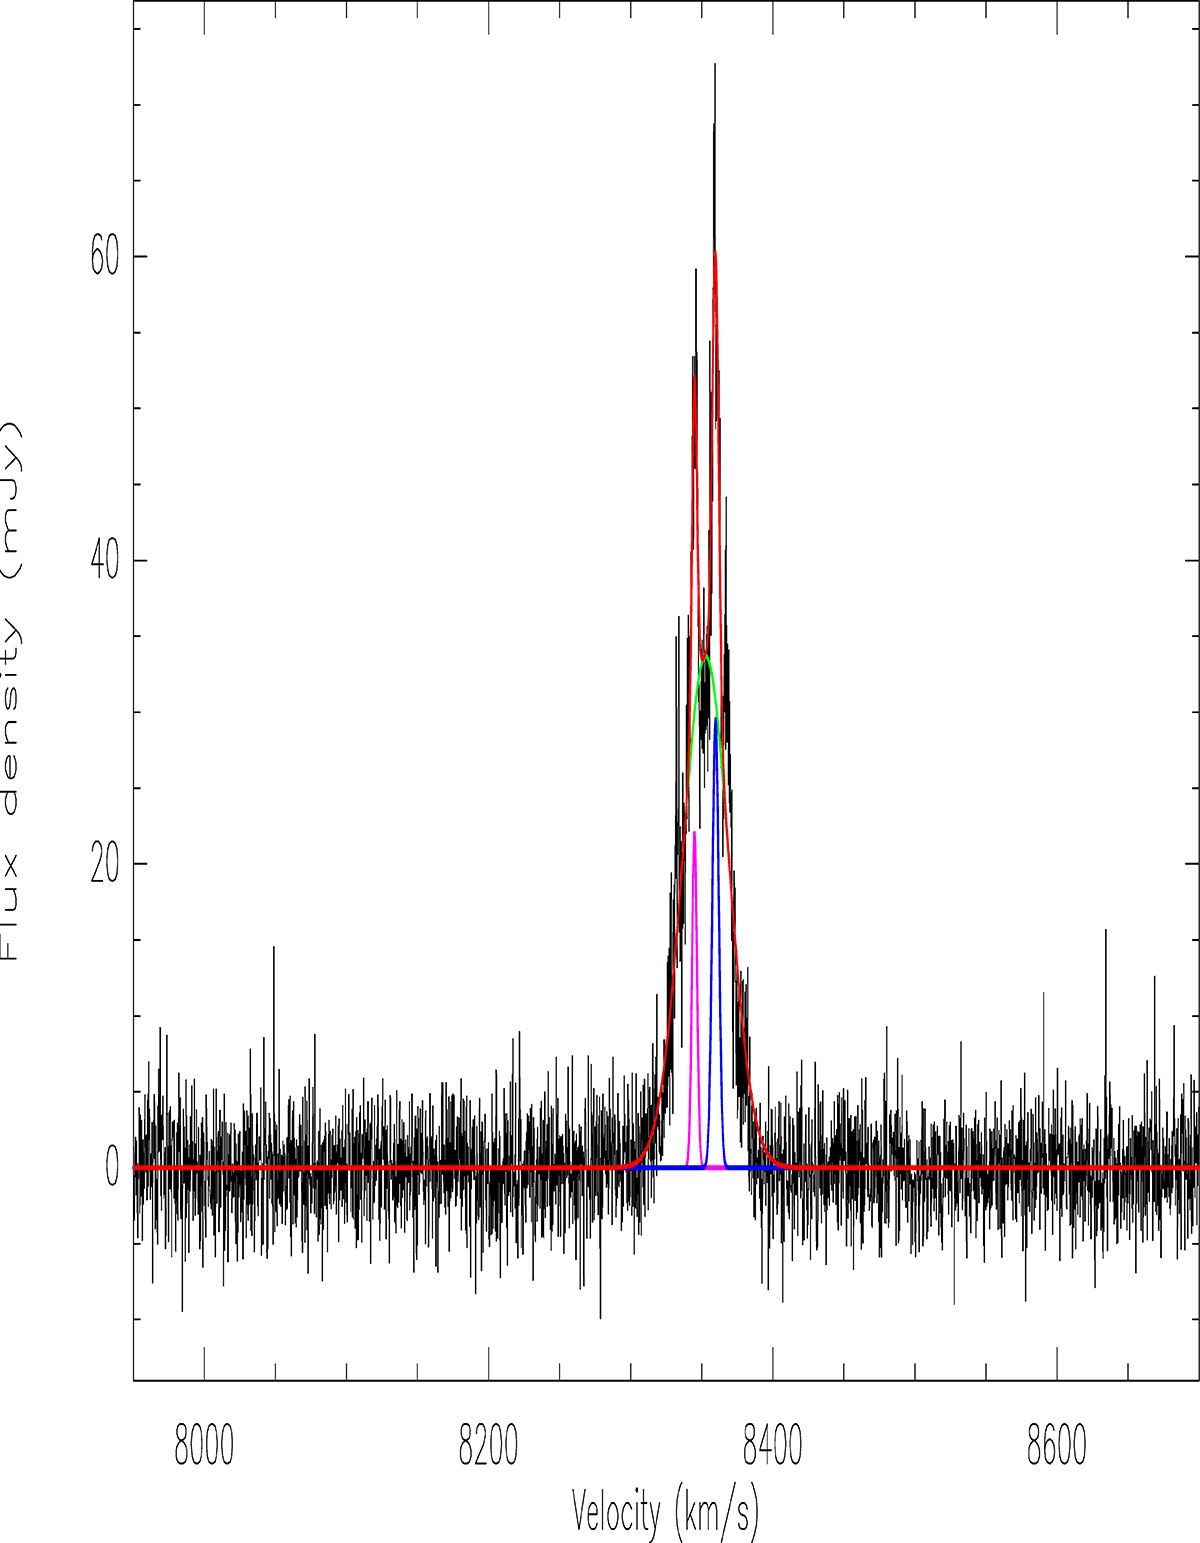
Spectrum of the component M1 detected towards IC 485 with the VLBA in epoch 2018.16. The thin red line is obtained by summing together the three Gaussian features. The three different Gaussian features are also reported in different colours (see Table 3): in violet, green, and blue are features 1, 2, and 3, respectively.
Current usage metrics show cumulative count of Article Views (full-text article views including HTML views, PDF and ePub downloads, according to the available data) and Abstracts Views on Vision4Press platform.
Data correspond to usage on the plateform after 2015. The current usage metrics is available 48-96 hours after online publication and is updated daily on week days.
Initial download of the metrics may take a while.