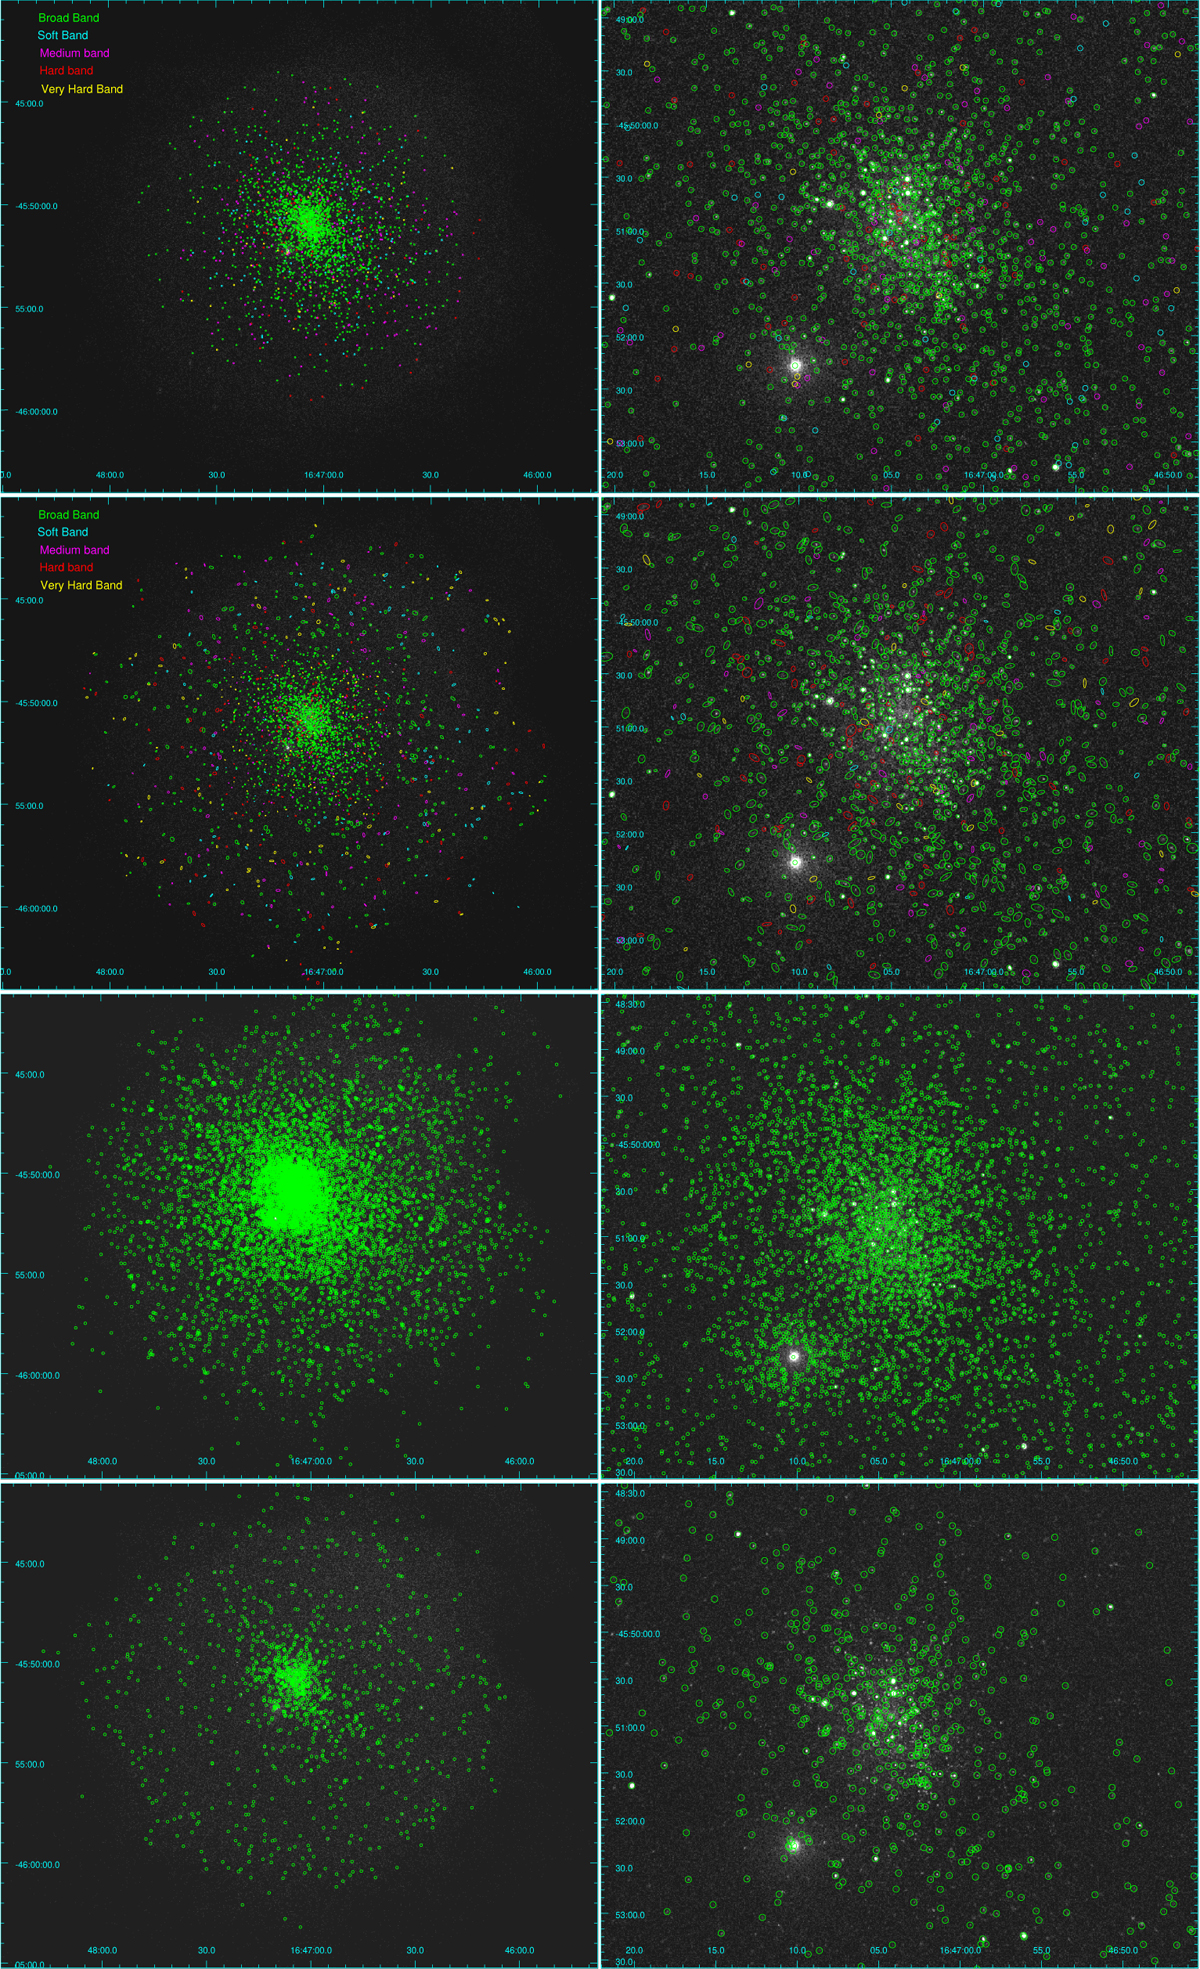
Fig. 5
Download original image
Spatial distribution of candidate sources detected with the four methods (from the top: Pwdetect, Wavdetect, image reconstruction, and time-resolved Pwdetect). The left panels show the whole ACIS field, those on the right the inner region. Different colors in the first and second rows mark sources detected at different energy bands.
Current usage metrics show cumulative count of Article Views (full-text article views including HTML views, PDF and ePub downloads, according to the available data) and Abstracts Views on Vision4Press platform.
Data correspond to usage on the plateform after 2015. The current usage metrics is available 48-96 hours after online publication and is updated daily on week days.
Initial download of the metrics may take a while.