Fig. 6
Download original image
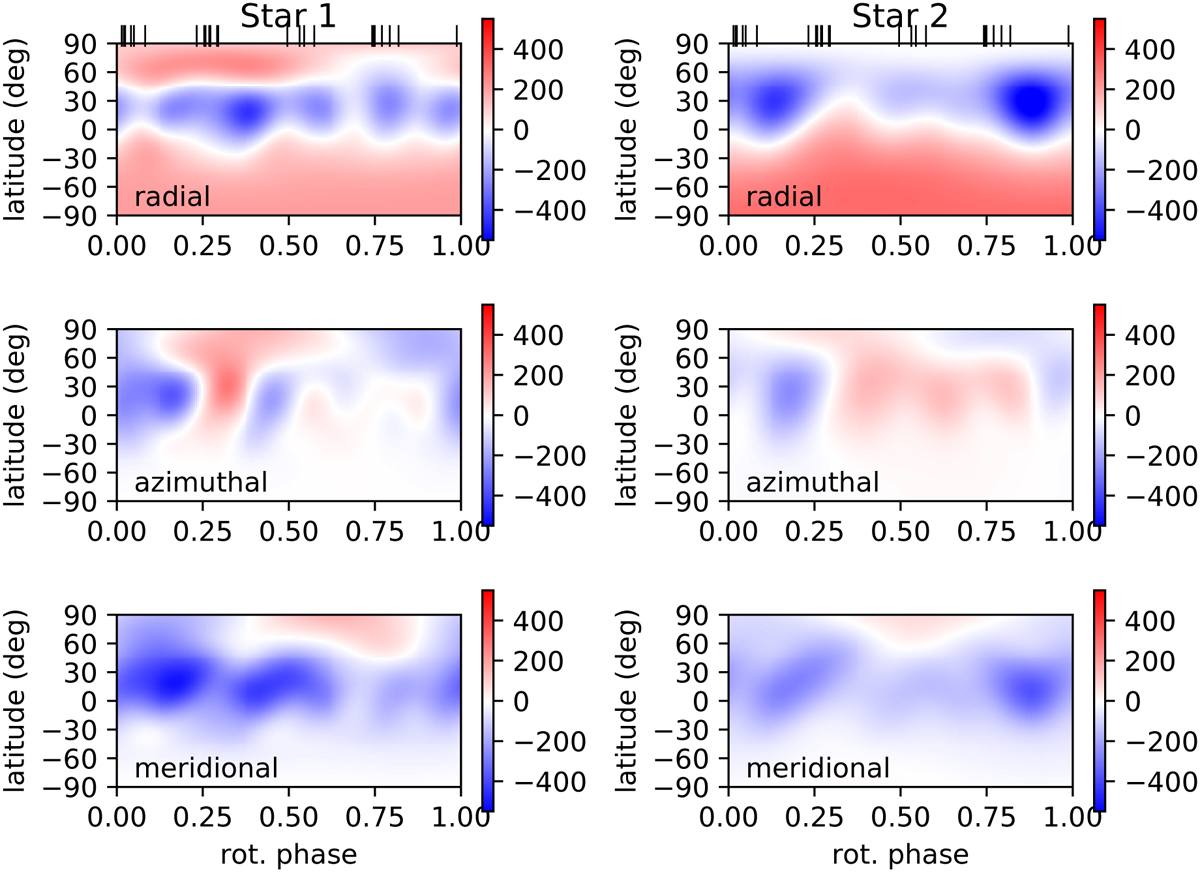
Magnetic maps of both components of the system FK Aqr (primary on the left and secondary on the right) for the observational period 3–16 September 2014. From top to bottom, we show the field components in spherical coordinates: radial, azimuthal, and meridional. On the right side of each subplot, we provide a colour bar showing the magnetic field strength expressed in gauss. The phases of the observations are marked on top of each radial map.
Current usage metrics show cumulative count of Article Views (full-text article views including HTML views, PDF and ePub downloads, according to the available data) and Abstracts Views on Vision4Press platform.
Data correspond to usage on the plateform after 2015. The current usage metrics is available 48-96 hours after online publication and is updated daily on week days.
Initial download of the metrics may take a while.