Open Access
Fig. 3
Download original image
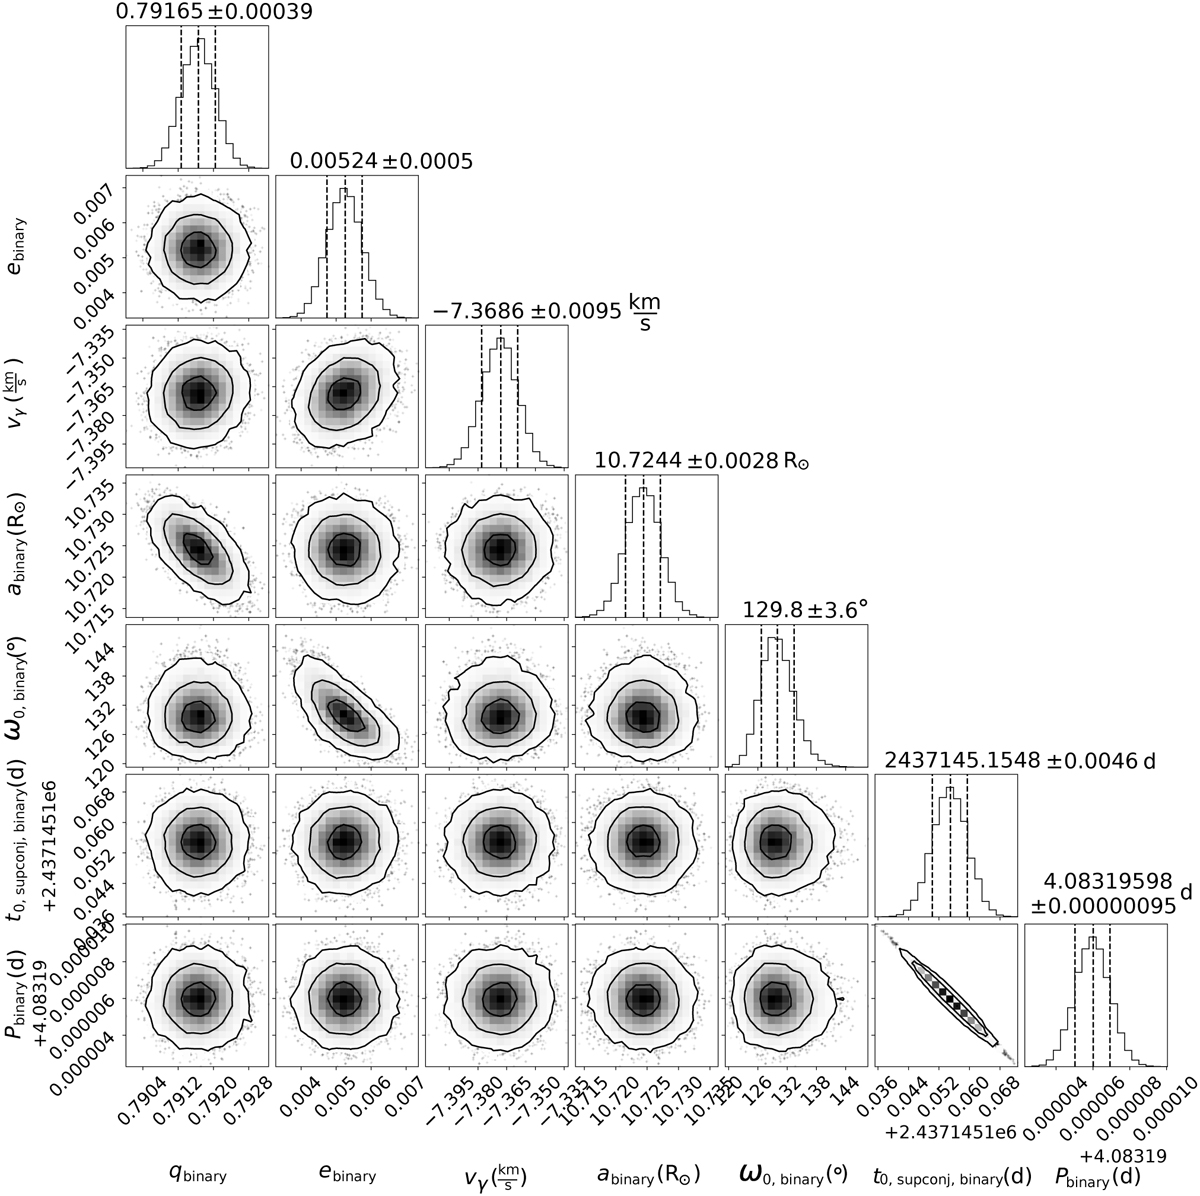
Corner plot of the posterior distributions for the PHOEBE RV model of FK Aqr using the EMCEE MCMC sampler. The dashed black lines correspond to the 16th, 50th, and 84th percentiles.
Current usage metrics show cumulative count of Article Views (full-text article views including HTML views, PDF and ePub downloads, according to the available data) and Abstracts Views on Vision4Press platform.
Data correspond to usage on the plateform after 2015. The current usage metrics is available 48-96 hours after online publication and is updated daily on week days.
Initial download of the metrics may take a while.