Fig. 1
Download original image
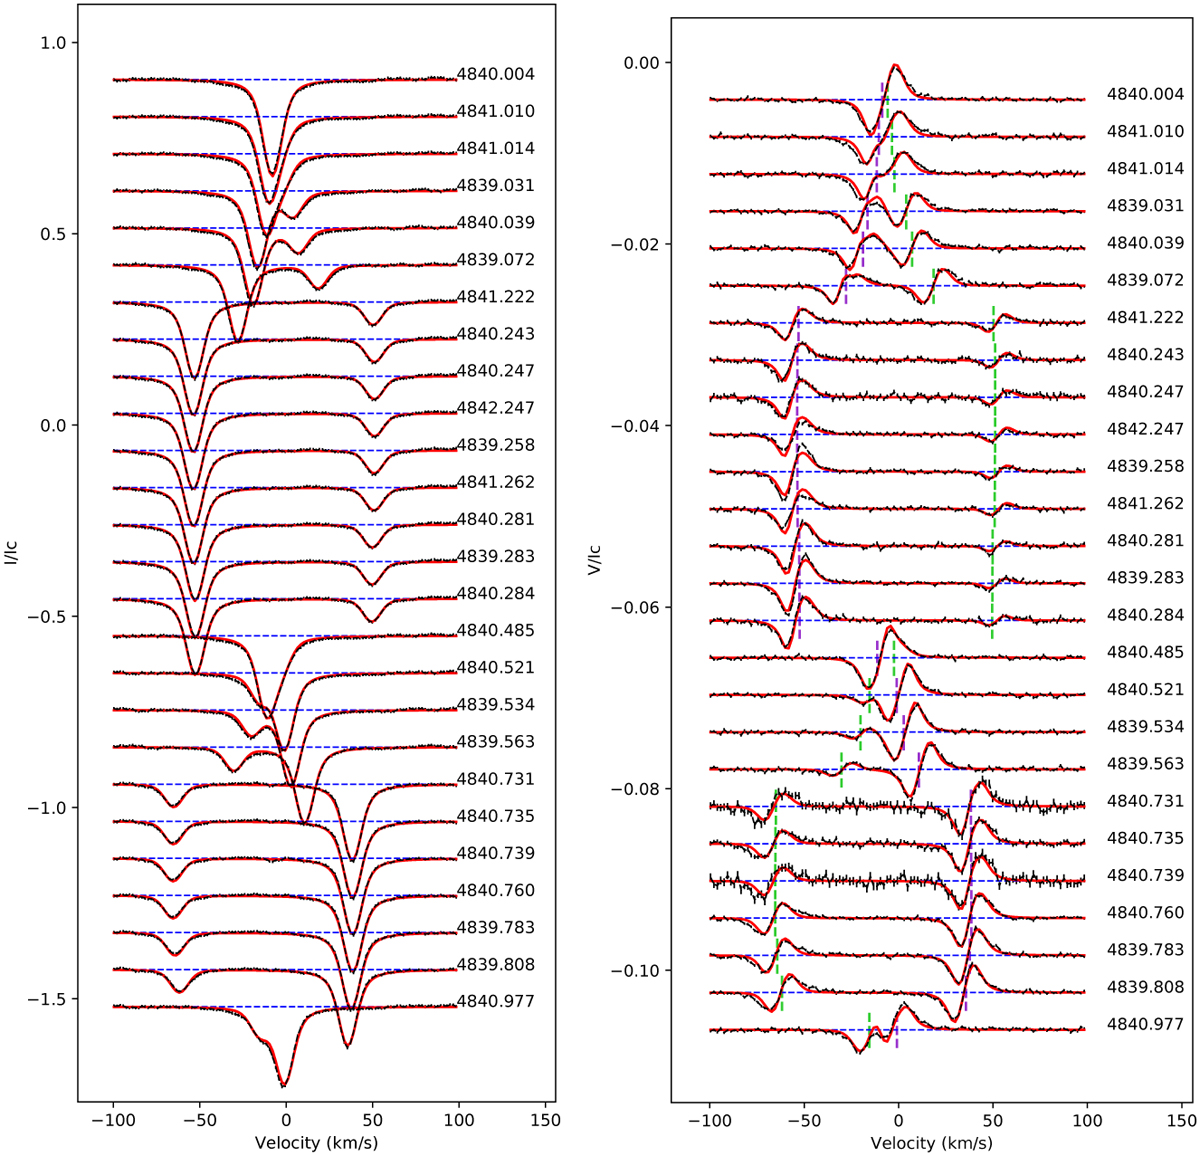
Normalised Stokes I and V profiles of FK Aqr in the observational period 3–16 September 2014. Observed profiles are plotted in dashed black lines, synthetic profiles are in red lines, and blue horizontal dashed lines are the zero level. All profiles are shifted vertically for display purposes. The rotational phases of the observations are indicated in the right part of the plot next to each profile. The vertical violet (for the primary) and green (for the secondary) dashed lines in the Stokes V panel indicate the center of the line profiles.
Current usage metrics show cumulative count of Article Views (full-text article views including HTML views, PDF and ePub downloads, according to the available data) and Abstracts Views on Vision4Press platform.
Data correspond to usage on the plateform after 2015. The current usage metrics is available 48-96 hours after online publication and is updated daily on week days.
Initial download of the metrics may take a while.