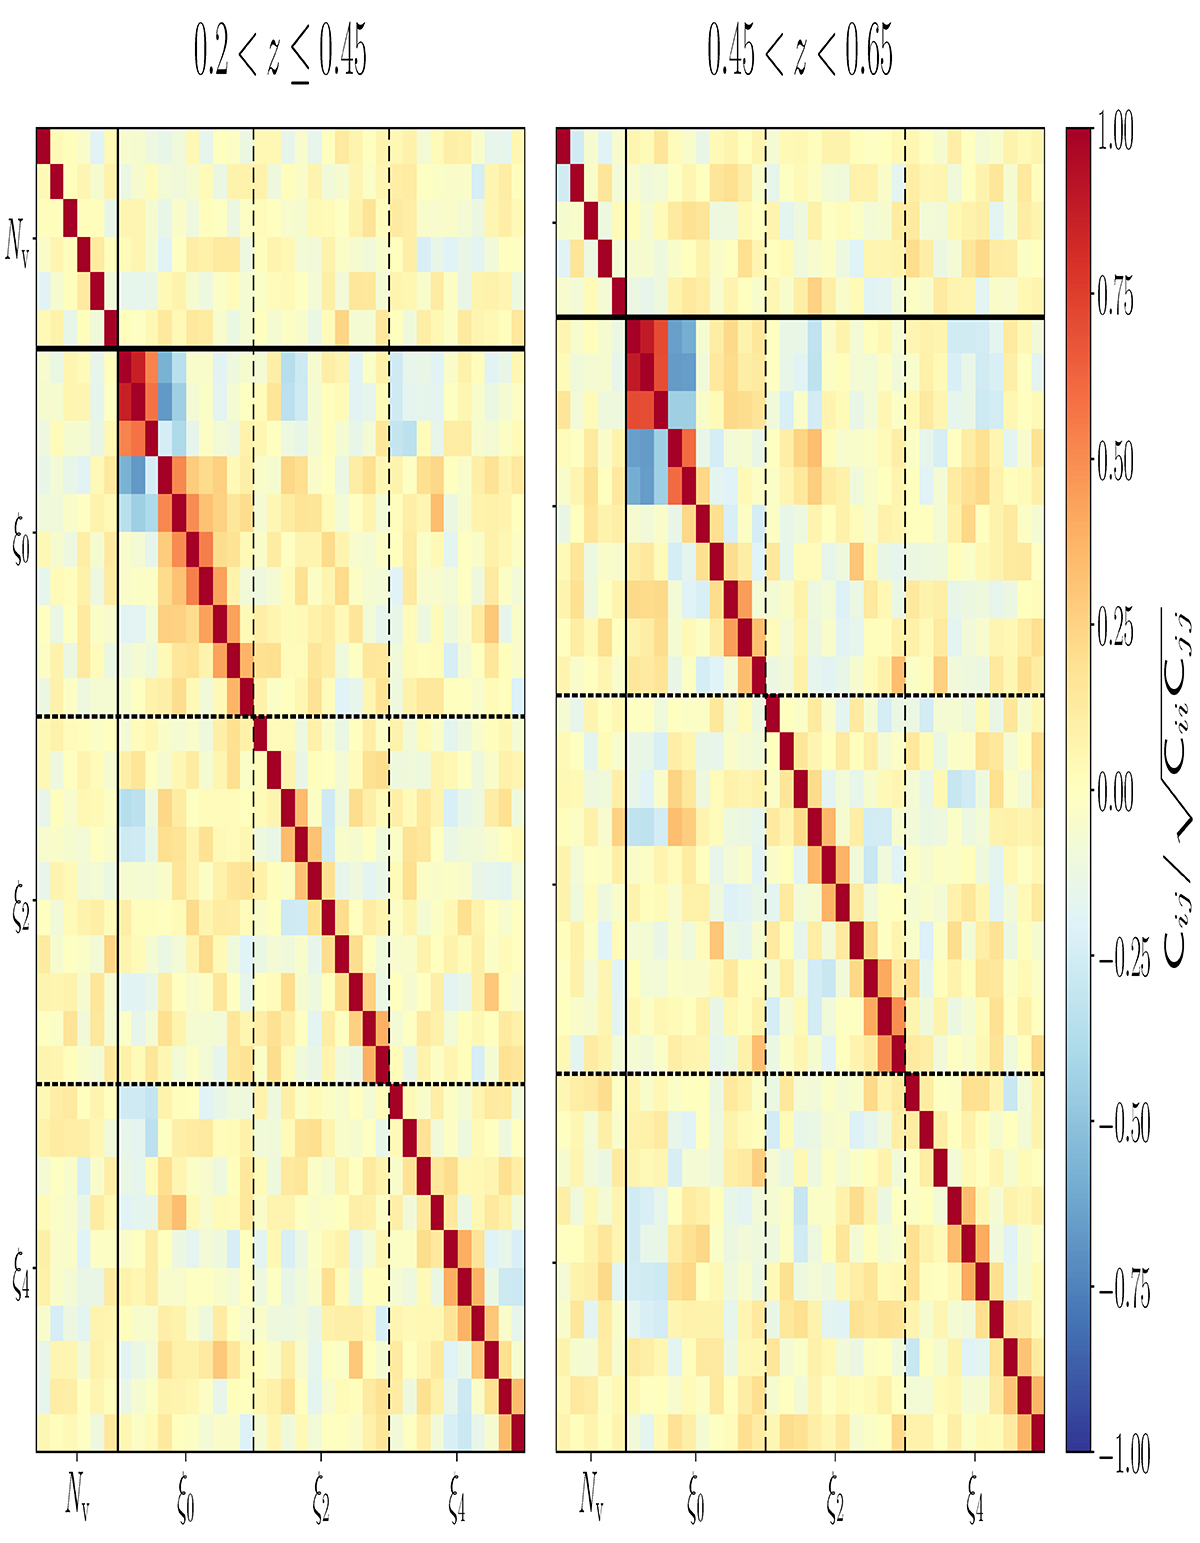
Fig. 1.
Download original image
Covariance matrix of void counts and stacked void-galaxy cross-correlation function (monopole, ξ0, quadrupole, ξ2, and hexadecapole, ξ4), computed via 100 PATCHY mocks. The matrix is normalized by its diagonal components and the two panels correspond to the redshift bins used in this analysis. The solid black lines divide the void size function data vector with the void-galaxy cross-correlation function ones, while the dashed lines separate the different multipoles from each other.
Current usage metrics show cumulative count of Article Views (full-text article views including HTML views, PDF and ePub downloads, according to the available data) and Abstracts Views on Vision4Press platform.
Data correspond to usage on the plateform after 2015. The current usage metrics is available 48-96 hours after online publication and is updated daily on week days.
Initial download of the metrics may take a while.