Fig. 8
Download original image
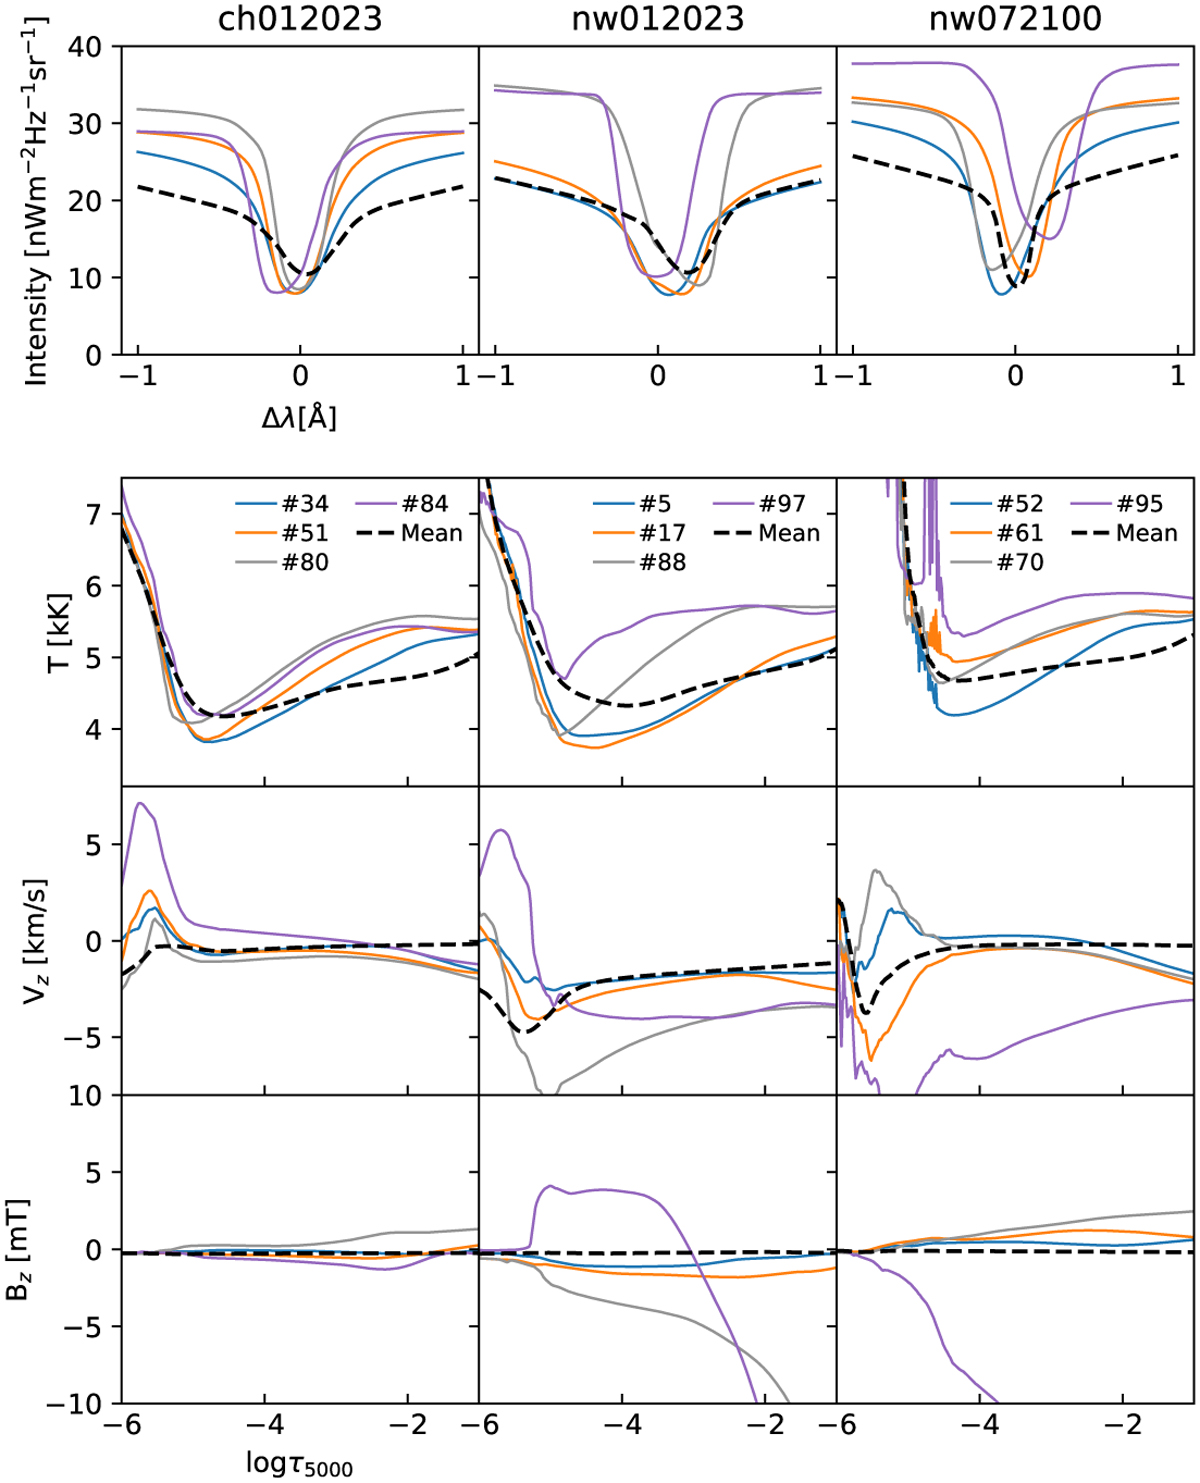
Mean spectra and atmospheric structure for selected clusters representing wide line profiles. Each column depicts four selected clusters for each of the three simulations, in addition to the mean for the full simulation box (dashed black line). The top row shows the mean spectra for each of the clusters, while the bottom three rows show the temperature, vertical velocity, and vertical magnetic field as a function of log τ5000. The cluster numbers for each simulation are indicated in the legend of the temperature plot.
Current usage metrics show cumulative count of Article Views (full-text article views including HTML views, PDF and ePub downloads, according to the available data) and Abstracts Views on Vision4Press platform.
Data correspond to usage on the plateform after 2015. The current usage metrics is available 48-96 hours after online publication and is updated daily on week days.
Initial download of the metrics may take a while.