Fig. 7
Download original image
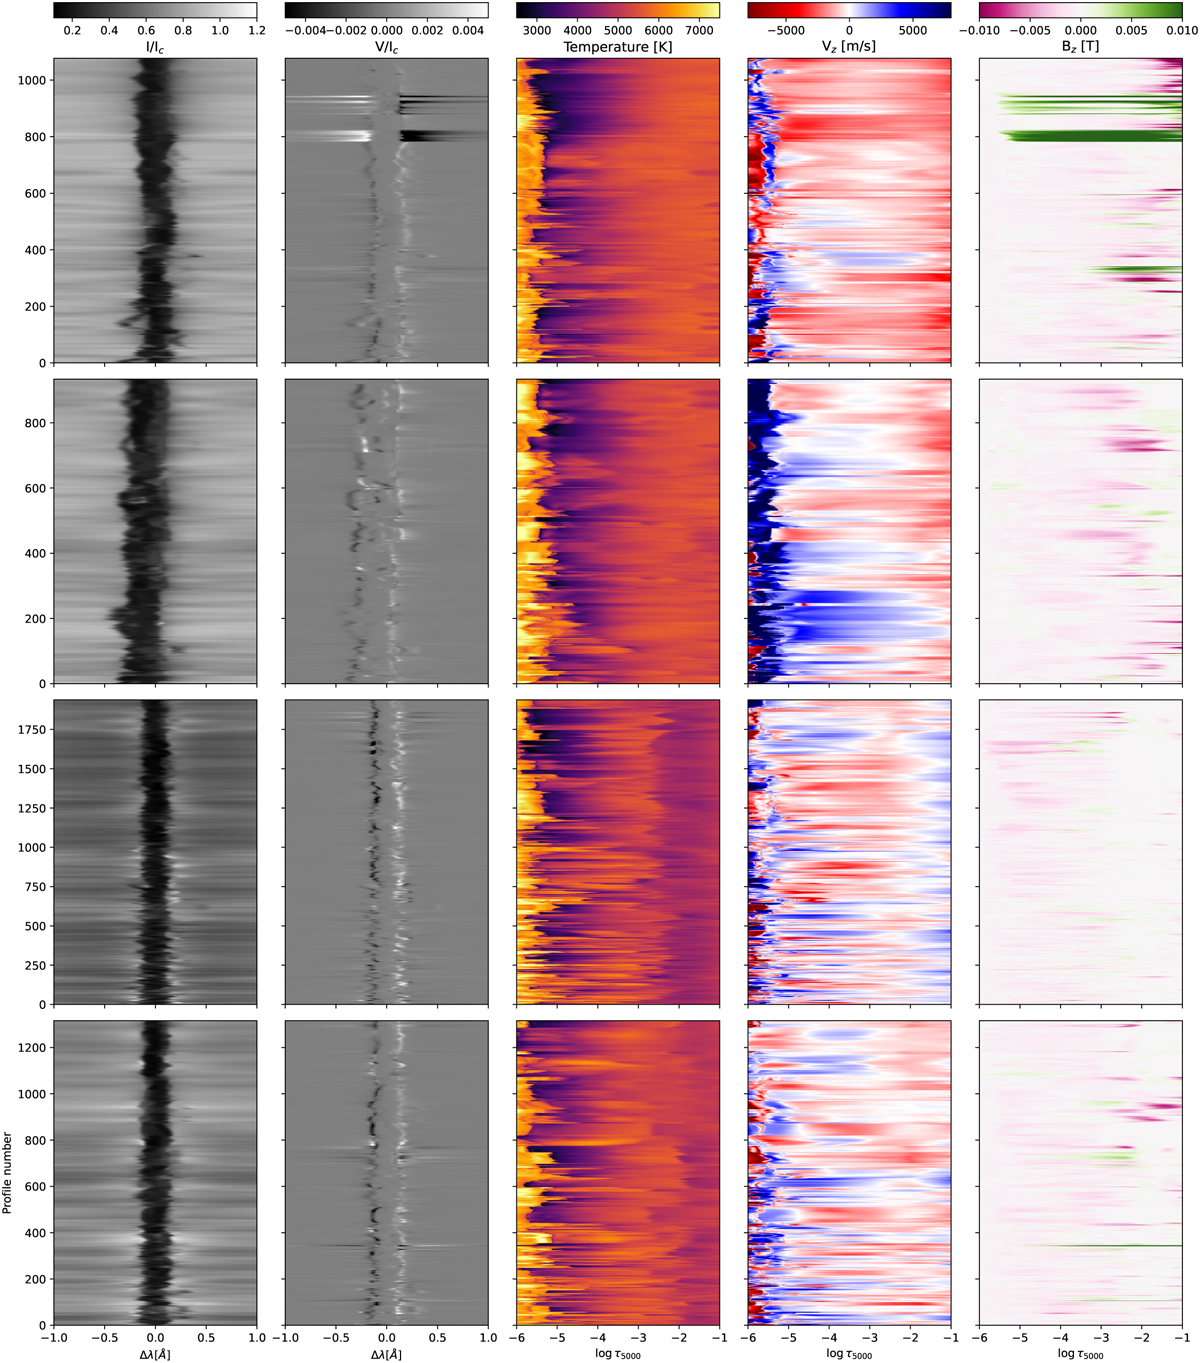
Individual spectra and atmospheric structure of selected clusters from the ch0l2023 simulation. From left to right, the first two columns show the Stokes I and V (normalized to the nearby continuum, around λ0 + 0.95 nm), while the last three columns show the temperature, vertical velocity, and vertical magnetic field as a function of log τ5000. Each row depicts a different cluster. From the top, the first and second are #80 and #84 (from the numbering in Fig. 4), and represent some of the wider line profiles. The third and fourth rows depict cluster numbers #57 and #75, which represent some of the narrowest line profiles.
Current usage metrics show cumulative count of Article Views (full-text article views including HTML views, PDF and ePub downloads, according to the available data) and Abstracts Views on Vision4Press platform.
Data correspond to usage on the plateform after 2015. The current usage metrics is available 48-96 hours after online publication and is updated daily on week days.
Initial download of the metrics may take a while.