Fig. 3
Download original image
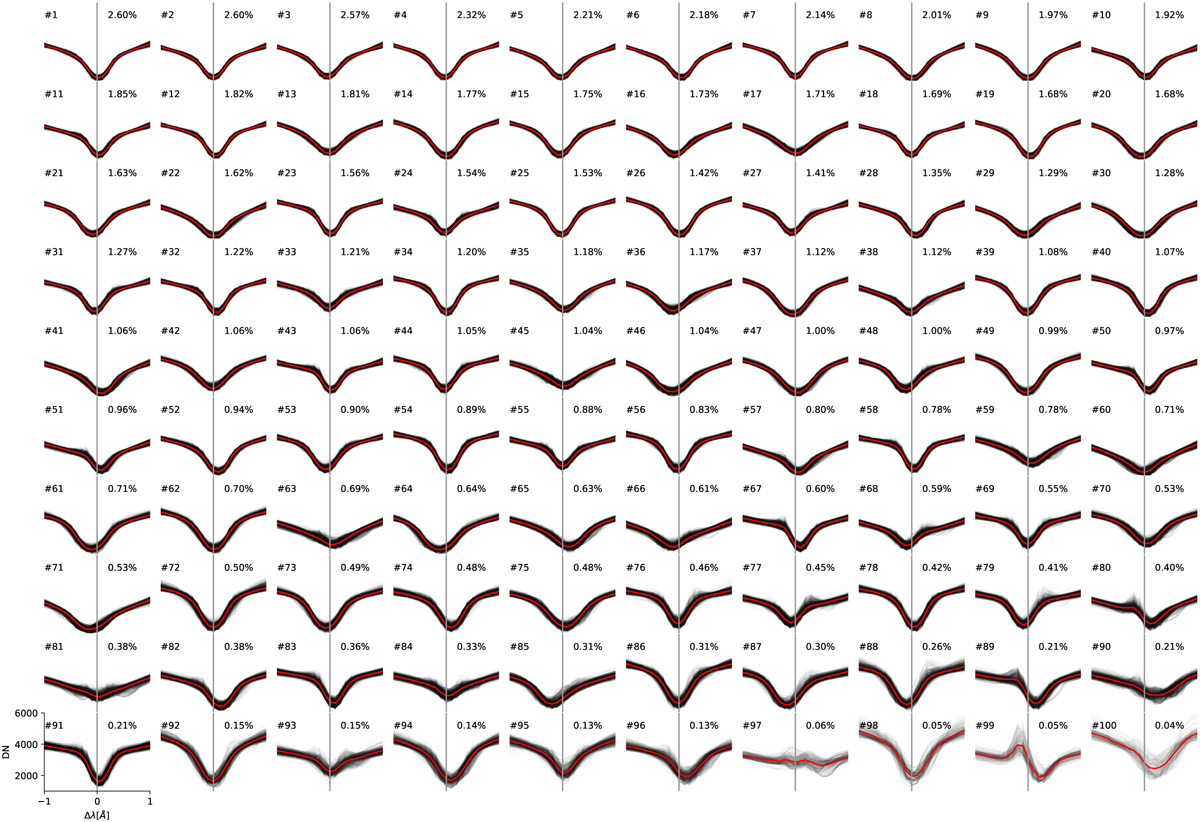
k-means clusters of Ca II 854.2 nm observed spectra, using 100 clusters, sorted from most to least frequent. The red line denotes the average of all line profiles belonging to each cluster (thin black lines). The fraction of all profiles belonging to each cluster is indicated as a percentage next to the cluster number. The gray line indicates the position of λ0, the rest wavelength.
Current usage metrics show cumulative count of Article Views (full-text article views including HTML views, PDF and ePub downloads, according to the available data) and Abstracts Views on Vision4Press platform.
Data correspond to usage on the plateform after 2015. The current usage metrics is available 48-96 hours after online publication and is updated daily on week days.
Initial download of the metrics may take a while.