Open Access
Fig. 2
Download original image
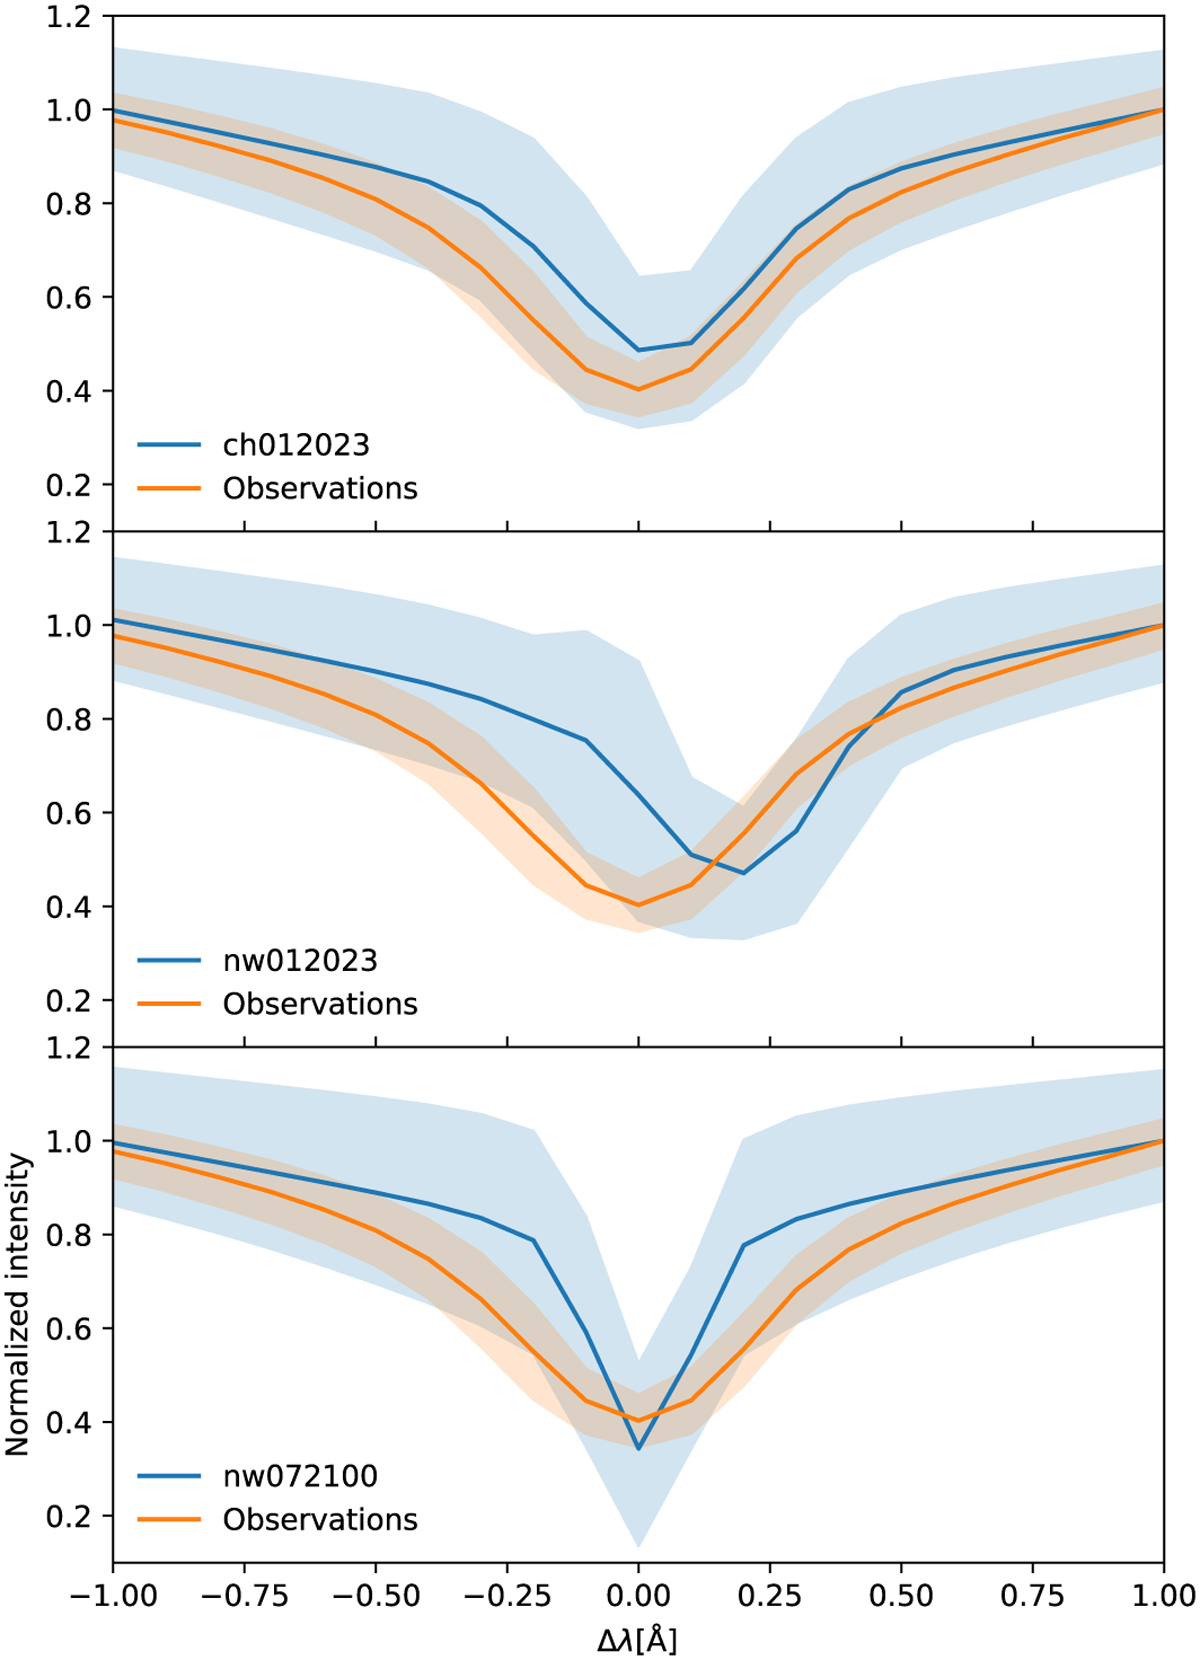
Mean spectra with 1σ variations for observations and three simulations. The shaded bands show, for each wavelength, the 1σ range of departures from the mean. All spectra were normalized to the local continuum at λ0 + 0.1 nm. The synthetic spectra were degraded to match the conditions of the observations.
Current usage metrics show cumulative count of Article Views (full-text article views including HTML views, PDF and ePub downloads, according to the available data) and Abstracts Views on Vision4Press platform.
Data correspond to usage on the plateform after 2015. The current usage metrics is available 48-96 hours after online publication and is updated daily on week days.
Initial download of the metrics may take a while.