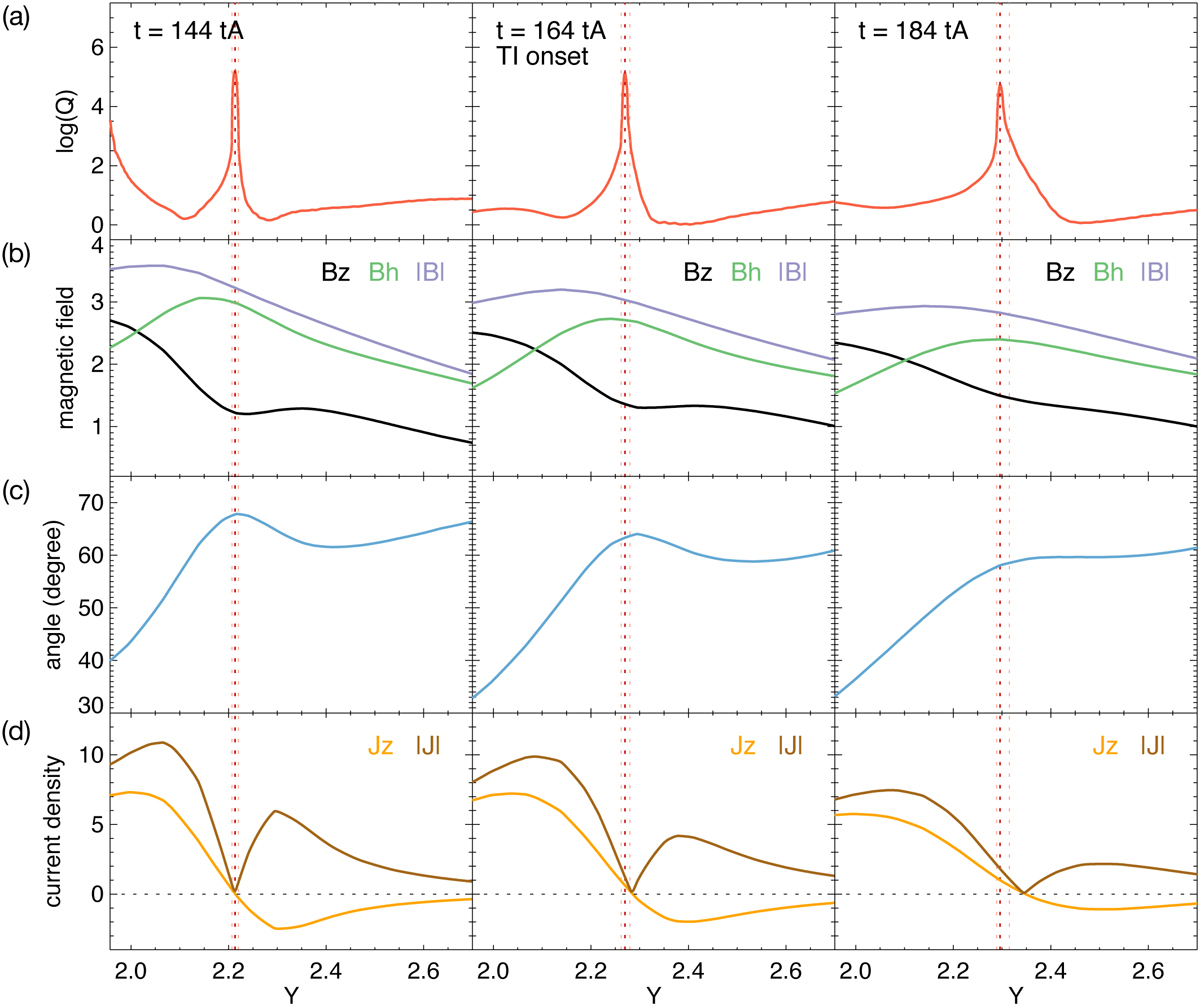
Fig. 9
Download original image
Profiles of 1D parameters along the slit (dashed lines in Fig. 8) crossing through the sunspot scar at t = 144 tA (first column), t = 164 tA (second column), and t = 184 tA (third column) in “Simulation 1”. From the top to the bottom, they are squashing degree (logQ; panel a), total magnetic field strength (|B|; panel b), horizontal magnetic field strength (Bh; panel b), vertical magnetic field strength (Bz; panel b), inclination angle (panel c), total current density (|J|; panel d), and vertical current density (Jz; panel d). The red dashed line in each column marks the peak of logQ. The pink dashed lines in each column show the range of the QSL footprint (logQ ≥ 3). The black horizontal dashed line in panel d marks the value where the current density equals zero.
Current usage metrics show cumulative count of Article Views (full-text article views including HTML views, PDF and ePub downloads, according to the available data) and Abstracts Views on Vision4Press platform.
Data correspond to usage on the plateform after 2015. The current usage metrics is available 48-96 hours after online publication and is updated daily on week days.
Initial download of the metrics may take a while.