Fig. 8
Download original image
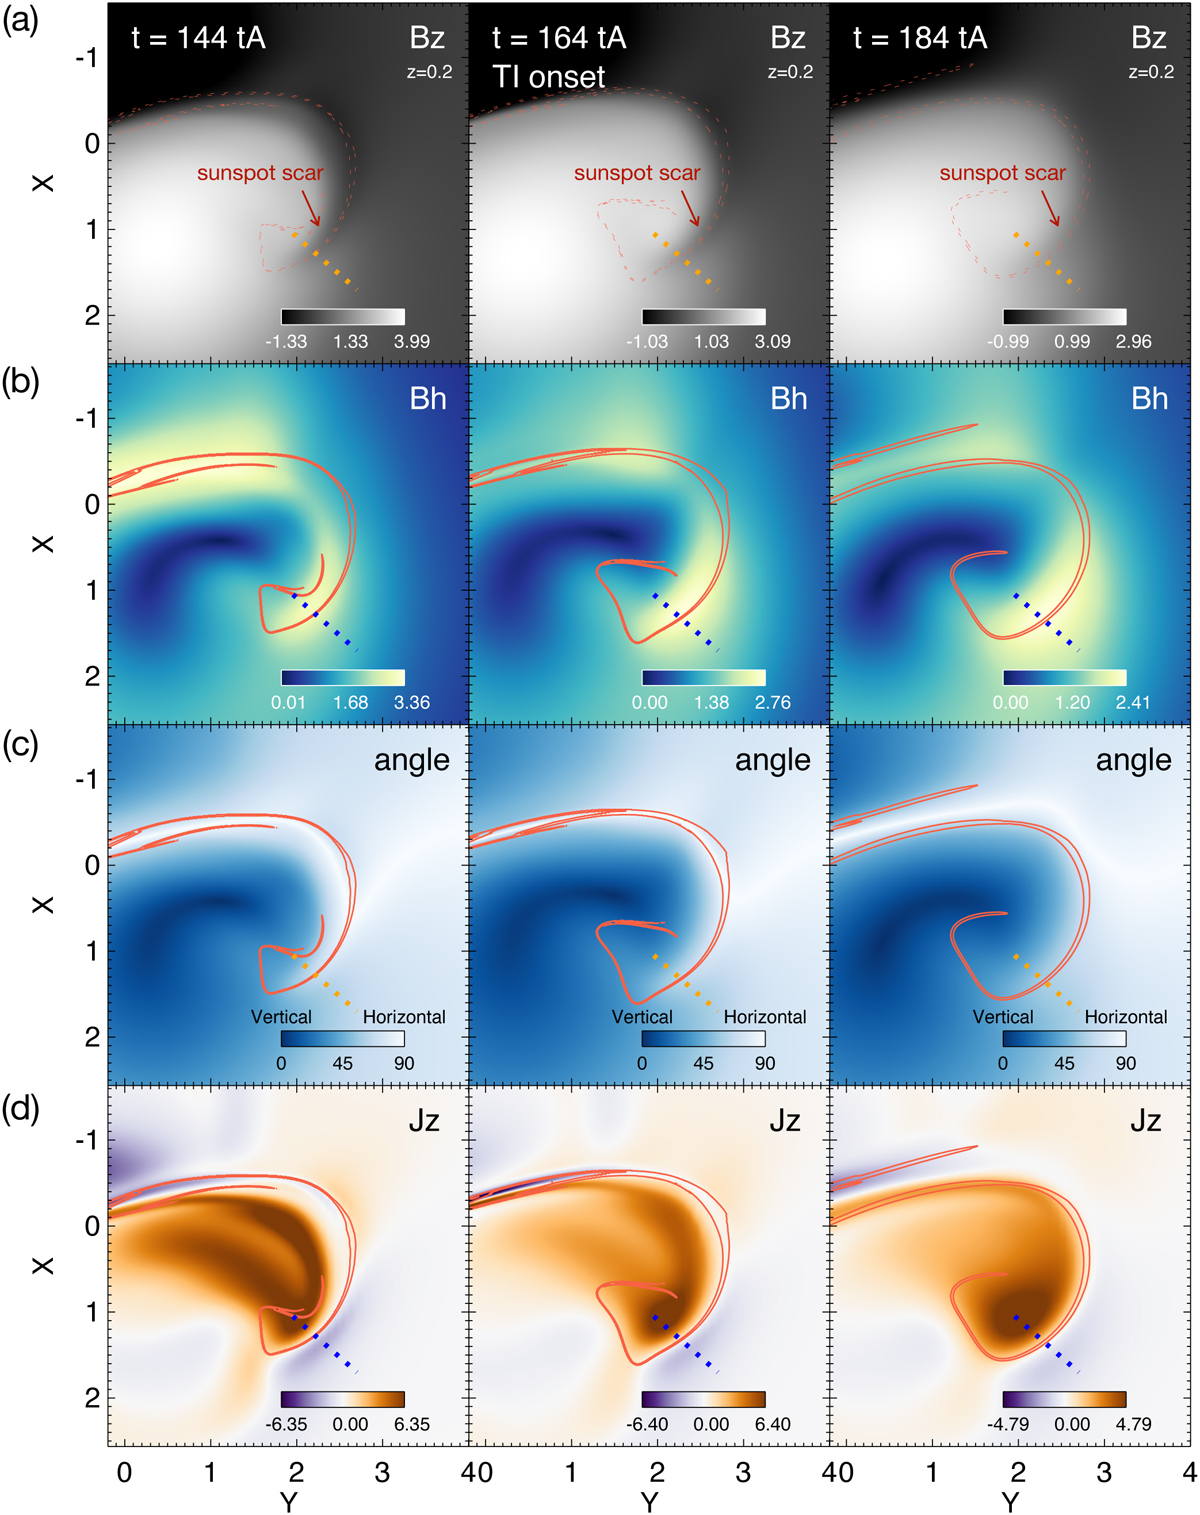
Distributions of vertical magnetic field strength (Bz; panel a), horizontal magnetic field strength (Bh; panel b), inclination angle (angle; panel c), and vertical current density (Jz; panel d) on the plane z = 0.2 at t = 144 tA (first column), t = 164 tA (second column), and t = 184 tA (third column) in “Simulation 1”. The red dashed or solid contour in each sub-panel shows the outline of the footprint of QSLs in this plane, in which logQ ≥ 3. The orange or blue dashed line in each sub-panel marks the slit crossing through the sunspot scar, whose 1D plots are shown in Fig. 9. A movie of this figure is available online.
Current usage metrics show cumulative count of Article Views (full-text article views including HTML views, PDF and ePub downloads, according to the available data) and Abstracts Views on Vision4Press platform.
Data correspond to usage on the plateform after 2015. The current usage metrics is available 48-96 hours after online publication and is updated daily on week days.
Initial download of the metrics may take a while.