Fig. 7
Download original image
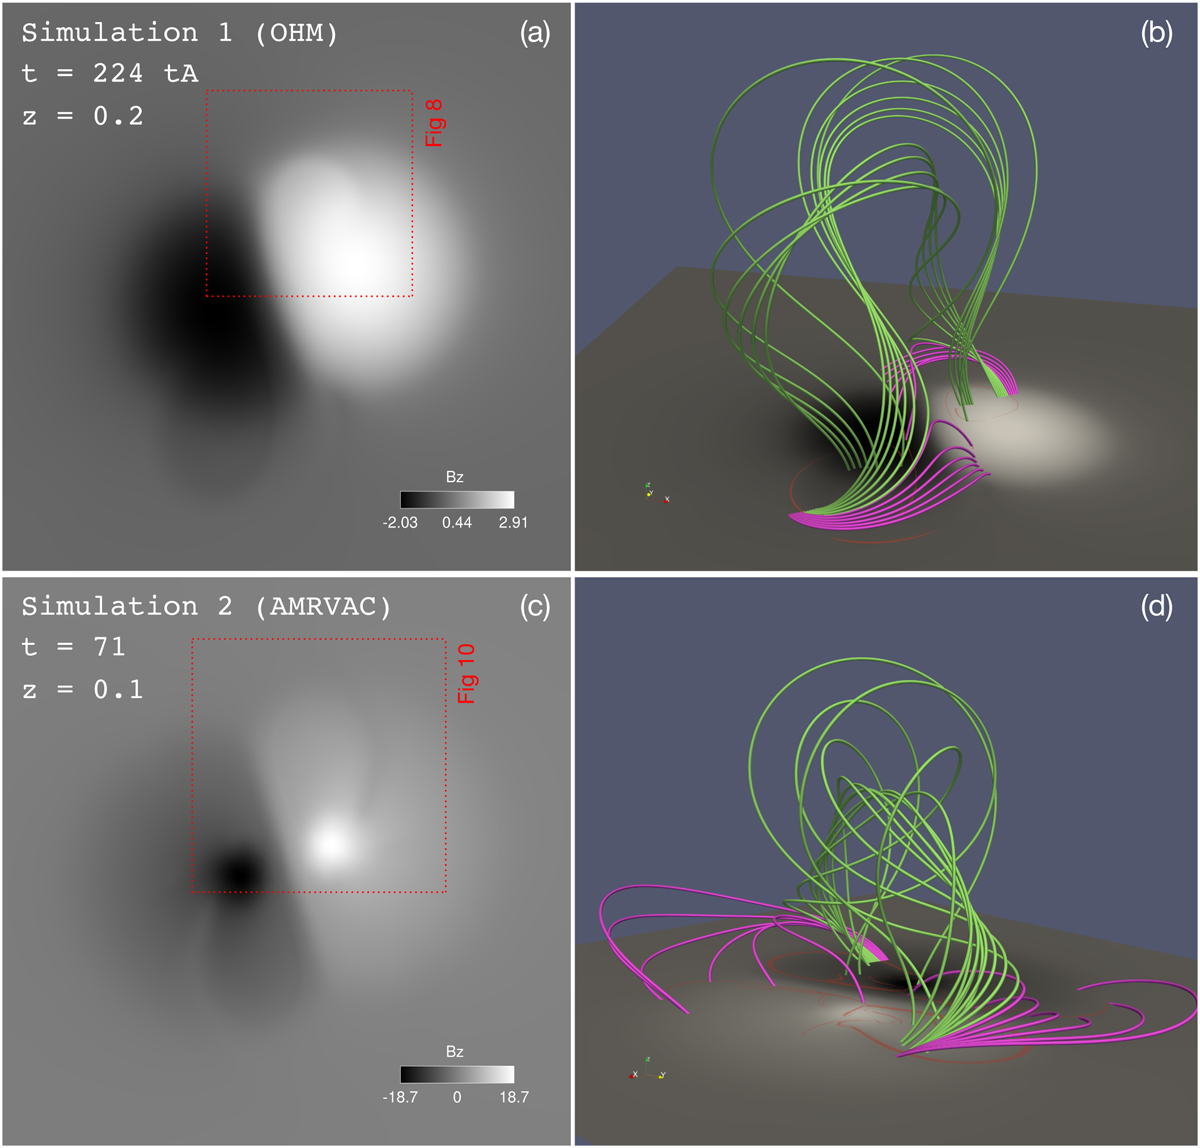
Snapshots of sunspot scars and the field lines traced from rakes crossing through sunspot scars for both “Simulation 1” and “Simulation 2”. (a) Snapshot of vertical magnetic field on the plane z = 0.2 at t = 224 tA in “Simulation 1”. The red dashed box shows the field of view in Fig. 8. (b) Magnetic field lines traced from two rakes at t = 224 tA which cross through the two sunspot scars in the two polarities, respectively. The green tubes represent the CME flux rope field lines and the magenta tubes represent the inclined loops. The bottom plane shows the vertical magnetic field on the plane z = 0.2, same as that in panel a. The red filled contours show the footprints of QSLs (logQ > 3) on this plane. (c) Snapshot of vertical magnetic field on the plane z = 0.1 at t = 71 in “Simulation 2”. The red dashed box shows the field of view in Fig. 10. (d) Similar to panel b, but for that at t = 71 in “Simulation 2”. The bottom plane shows the vertical magnetic field on the plane z = 0.1, same as that in panel c. The green tubes, magenta tubes, and red filled contours have the same meanings as those in panel b.
Current usage metrics show cumulative count of Article Views (full-text article views including HTML views, PDF and ePub downloads, according to the available data) and Abstracts Views on Vision4Press platform.
Data correspond to usage on the plateform after 2015. The current usage metrics is available 48-96 hours after online publication and is updated daily on week days.
Initial download of the metrics may take a while.