Fig. 6
Download original image
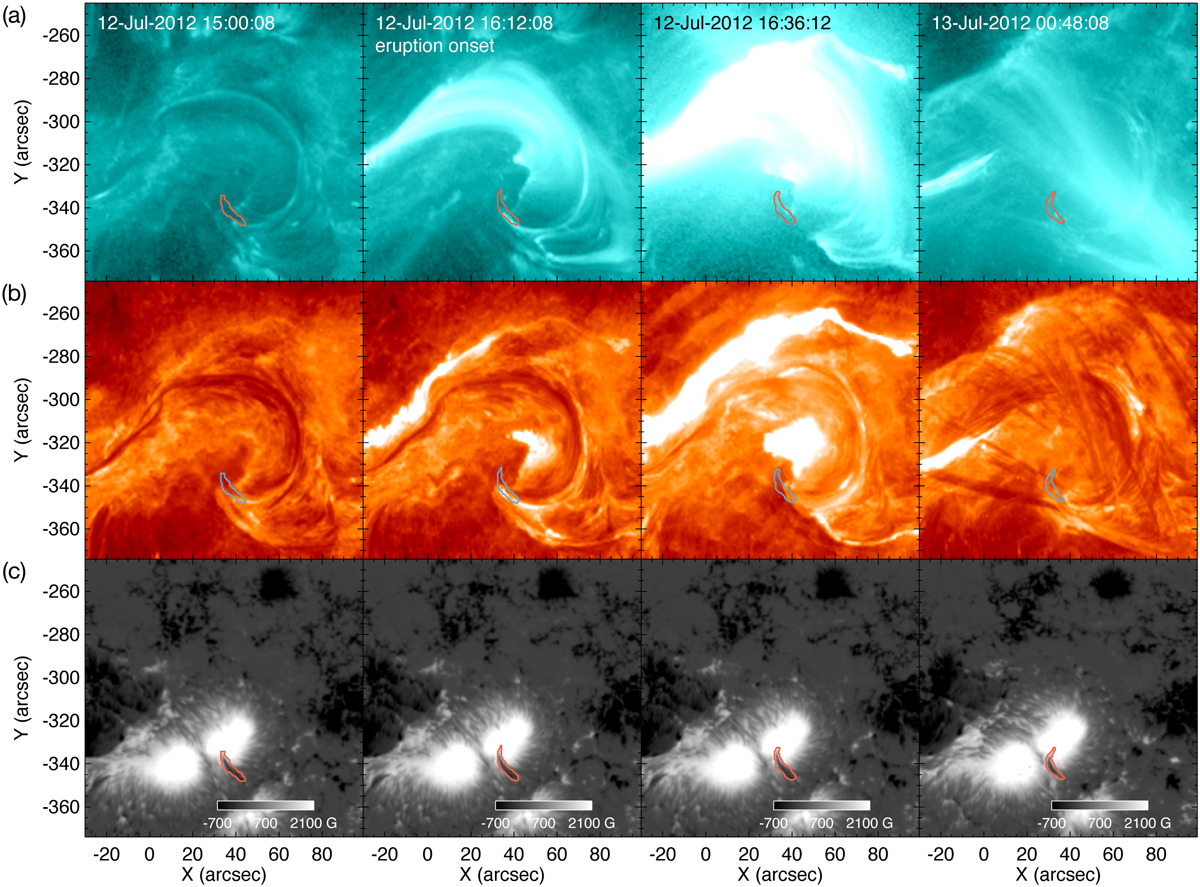
131 Å images (panel a), 304 Å images (panel b), and vertical magnetic field images (panel c) of the source region, which are all in helioprojective-Cartesian coordinate and at four moments. The time of images in each column is shown in the first row of them. The red or blue contours in all sub-panels outline the sunspot scar.
Current usage metrics show cumulative count of Article Views (full-text article views including HTML views, PDF and ePub downloads, according to the available data) and Abstracts Views on Vision4Press platform.
Data correspond to usage on the plateform after 2015. The current usage metrics is available 48-96 hours after online publication and is updated daily on week days.
Initial download of the metrics may take a while.