Fig. 5
Download original image
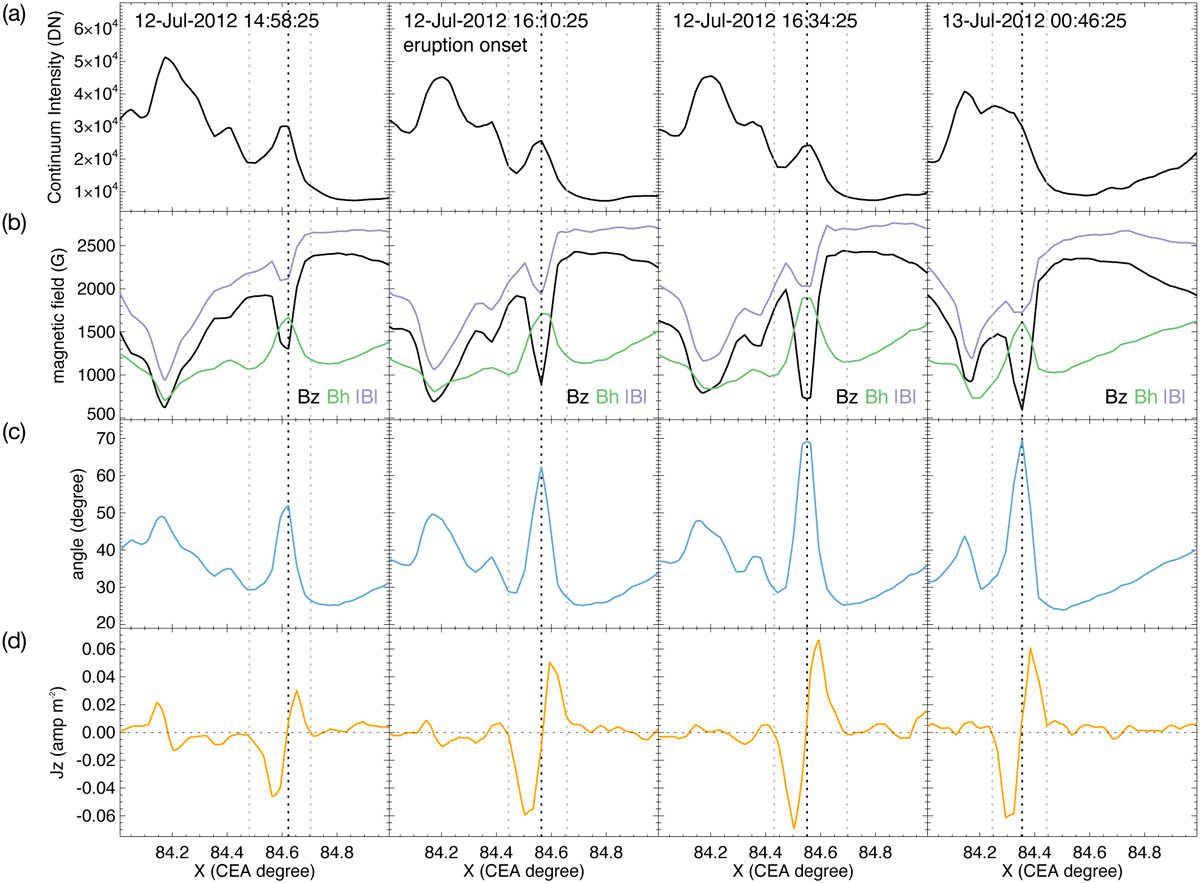
1D parameters along the slit crossing through the sunspot scar (dashed lines in Fig. 4). From the top to the bottom, they are continuum intensity (panel a), total magnetic field strength (|B|; panel b), vertical magnetic field strength (Bz; panel b), horizontal magnetic field strength (Bh; panel b), inclination angle (panel c), and vertical current density (Jz; panel d). The time of sub-panels in each column is shown in the first row of them. The black vertical dashed line in each column marks the dip of Bz in the sunspot scar, which is regarded as the sunspot scar center. The gray dashed lines in each column show the range of the two peaks in Jz which are at two sides of the sunspot scar, representing the edges of the sunspot scar. The black horizontal dashed line in panel d marks the value where the current density equals zero.
Current usage metrics show cumulative count of Article Views (full-text article views including HTML views, PDF and ePub downloads, according to the available data) and Abstracts Views on Vision4Press platform.
Data correspond to usage on the plateform after 2015. The current usage metrics is available 48-96 hours after online publication and is updated daily on week days.
Initial download of the metrics may take a while.