Fig. 4
Download original image
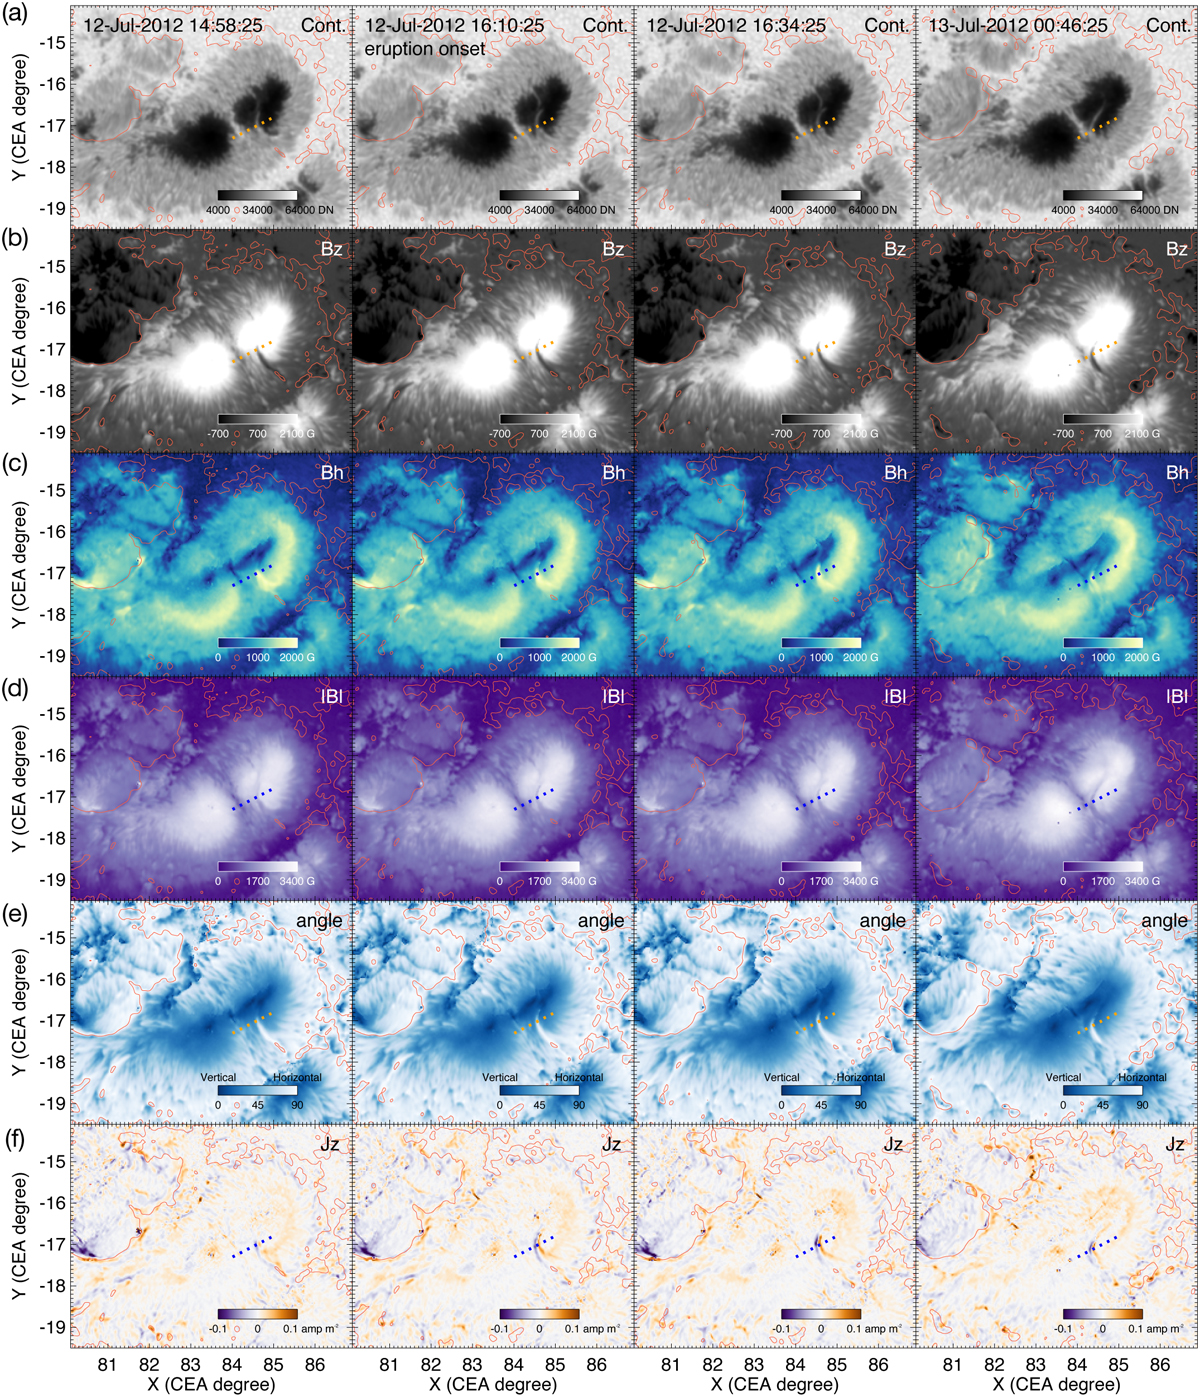
Continuum intensity (Cont.; panel a), vertical magnetic field strength (Bz; panel b), horizontal magnetic field strength (Bh; panel c), total magnetic field strength (|B|; panel d), inclination angle of the direction of magnetic field to the vertical direction (angle; panel e), and the vertical current density (Jz; panel f) images of the source region, which are in SHARP CEA coordinate and at four moments. The time of images in each column is shown in the first row of them. The red contour in each sub-panel shows the PIL. The orange or blue dashed line in each sub-panel is the slit crossing though the sunspot scar, along which the 1D parameters are shown in Fig. 5. A movie of this figure is available online.
Current usage metrics show cumulative count of Article Views (full-text article views including HTML views, PDF and ePub downloads, according to the available data) and Abstracts Views on Vision4Press platform.
Data correspond to usage on the plateform after 2015. The current usage metrics is available 48-96 hours after online publication and is updated daily on week days.
Initial download of the metrics may take a while.