Fig. 3
Download original image
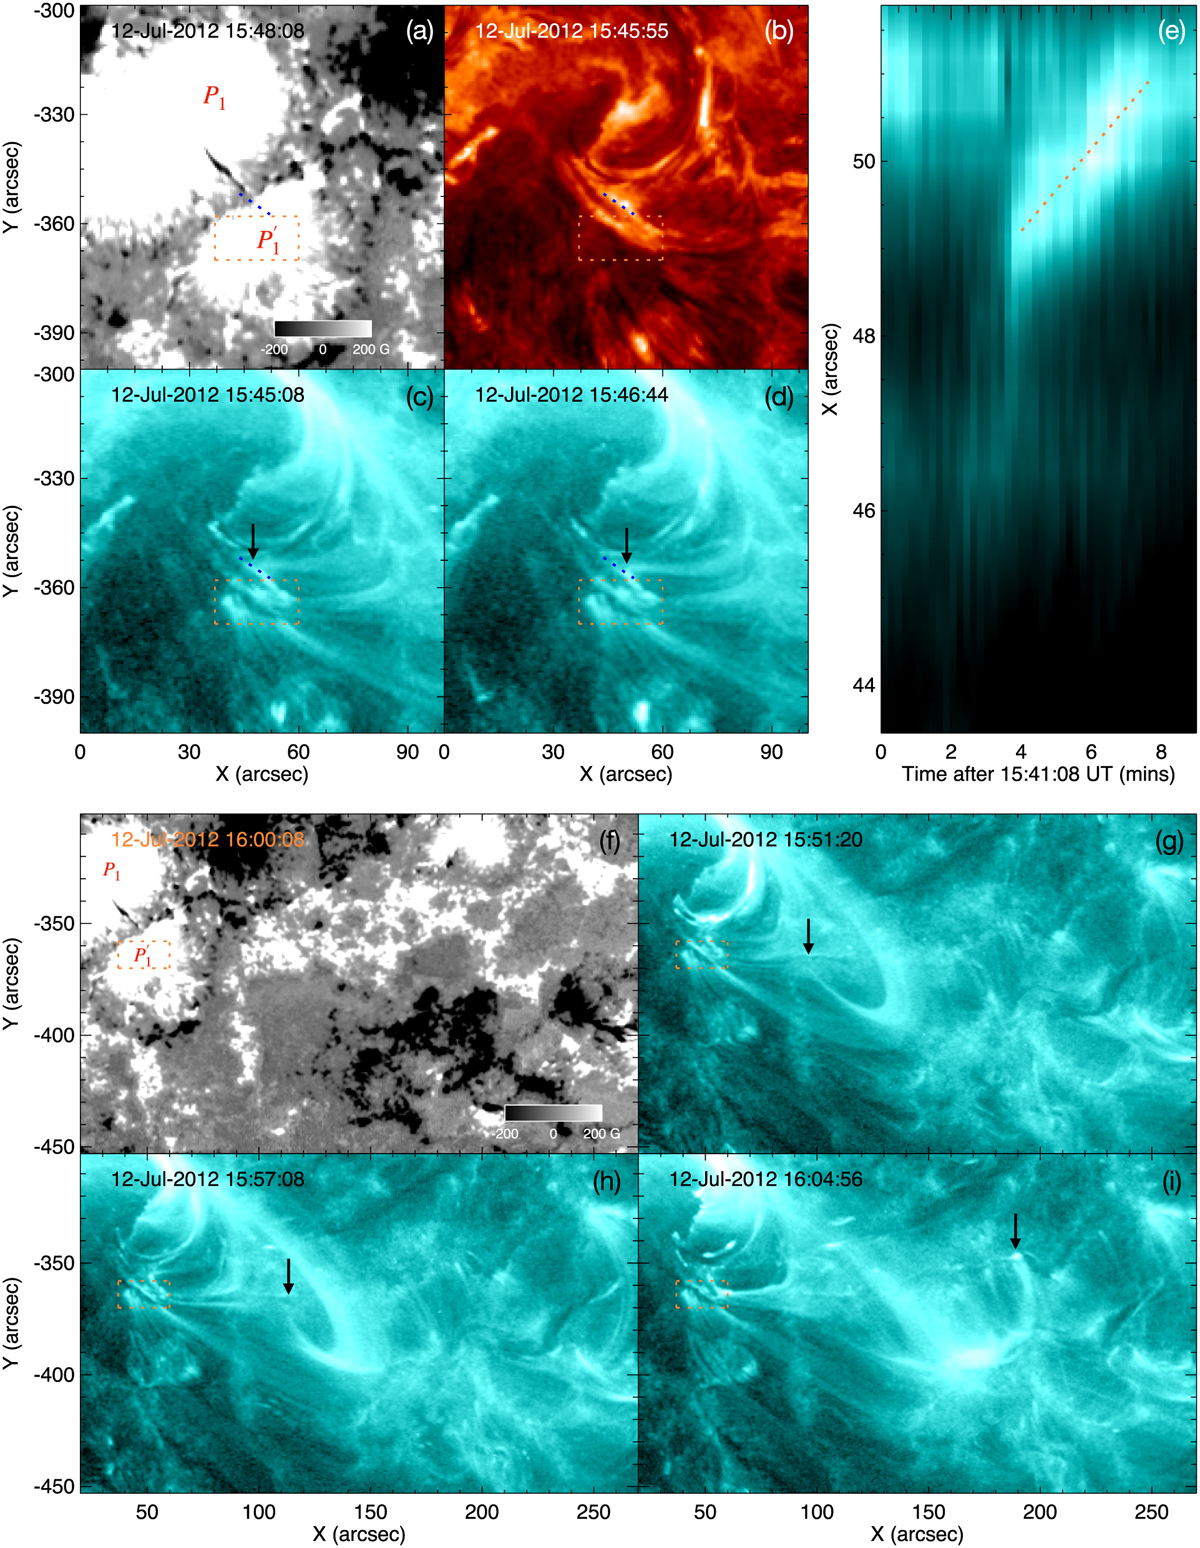
Slipping motions of loops in the western leg of the hot channel, from the main positive sunspot to the adjacent positive sunspot (panels a–e) and further from the adjacent positive sunspot toward west (panels f–i). (a) Vertical magnetic field image showing the main positive sunspot and the adjacent positive sunspot (P′1). (b) 304 Å image with a same field of view as panel a. (c, d) 131 Å images with a same field of view as panel a. In panels a–d, the orange dashed box marks the western footpoint region of the hot channel, and the blue dashed line represents the bright lane along which the bright loops at the 131 Å passband slip. The black arrows mark the footpoints of the slipping bright loops. (e) Time-slice plot of the 131 Å intensity along the blue dashed line in panels c and d. The orange dashed line in it marks the slipping motion of the bright loop footpoint. (f) Vertical magnetic field image showing the main positive polarity (P1), the adjacent positive polarity (P′1), and the western positive-polarity faculae. (g–i) 131 Å images with a same field of view as panel f. The orange dashed box in panels f–i is the same as that in panels a–d. The black arrows mark the footpoints of the slipping bright loops.
Current usage metrics show cumulative count of Article Views (full-text article views including HTML views, PDF and ePub downloads, according to the available data) and Abstracts Views on Vision4Press platform.
Data correspond to usage on the plateform after 2015. The current usage metrics is available 48-96 hours after online publication and is updated daily on week days.
Initial download of the metrics may take a while.