Fig. 2
Download original image
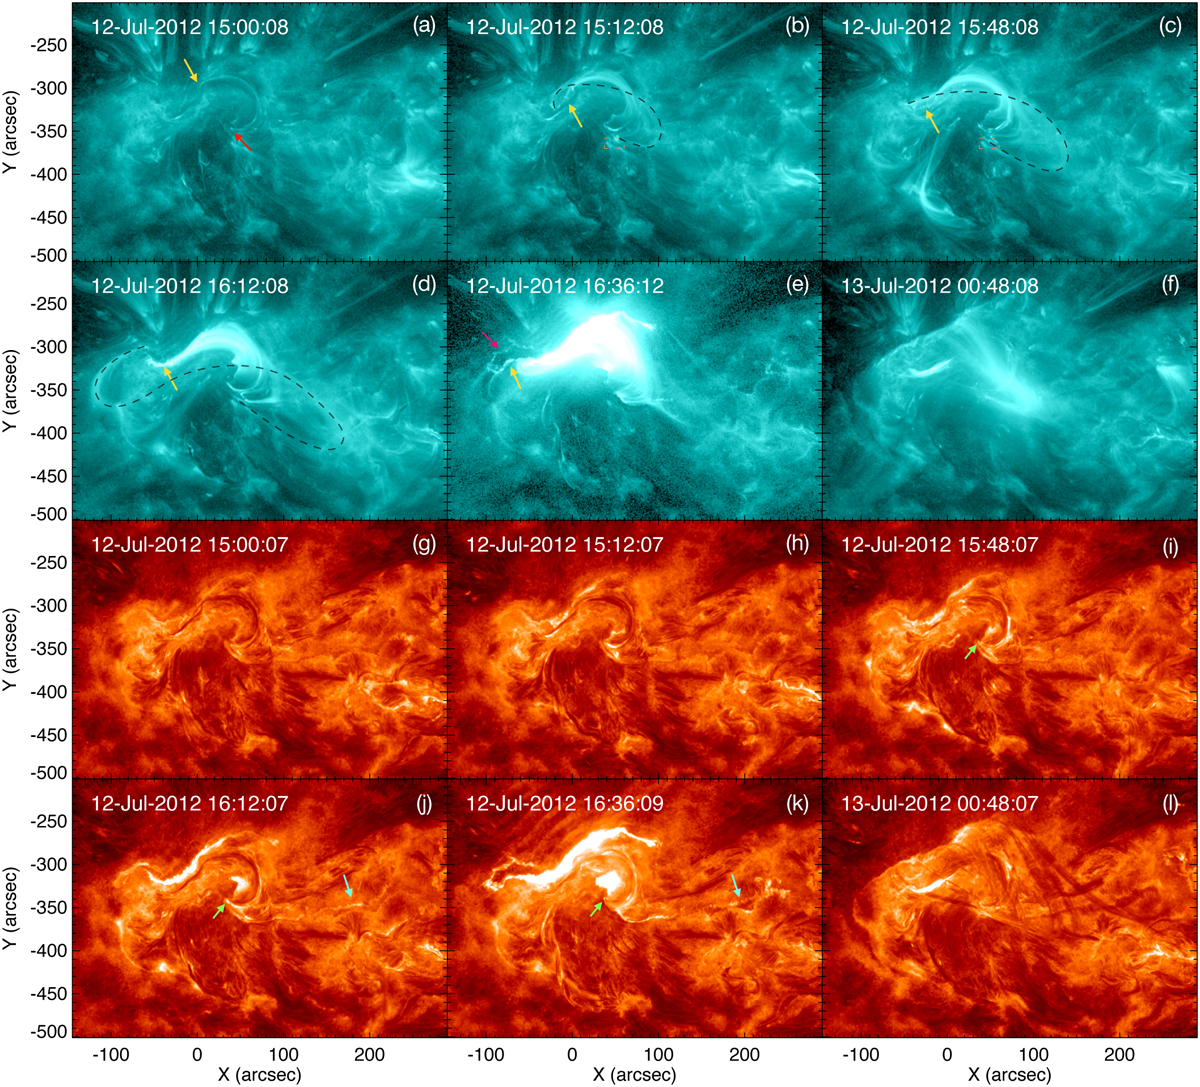
AIA 131 Å images (panels a–f) and 304 Å images (panels g-l) of the source region of the CME-flare event on July 12, 2012. The red arrow in panel a marks the first bright arcade at 15:00 UT. The yellow arrows in panels a–e mark the slipping motion of the eastern footpoints of the bright arcades in the negative polarity. The dashed lines in panels b–d show the pre-eruptive hot channel. The orange dashed box in panels b and c marks the western footpoint region of the hot channel. The eastern footpoint of the CME is marked by the purple arrow in panel e and the western one is marked by the blue arrow in panel k. The blue arrow in panel j shows the narrow ribbon lane along which the bright loops slip. The green arrows in panels i–k point the western footpoint of the low-lying filament. Two movies of this figure are available online.
Current usage metrics show cumulative count of Article Views (full-text article views including HTML views, PDF and ePub downloads, according to the available data) and Abstracts Views on Vision4Press platform.
Data correspond to usage on the plateform after 2015. The current usage metrics is available 48-96 hours after online publication and is updated daily on week days.
Initial download of the metrics may take a while.