Fig. 13
Download original image
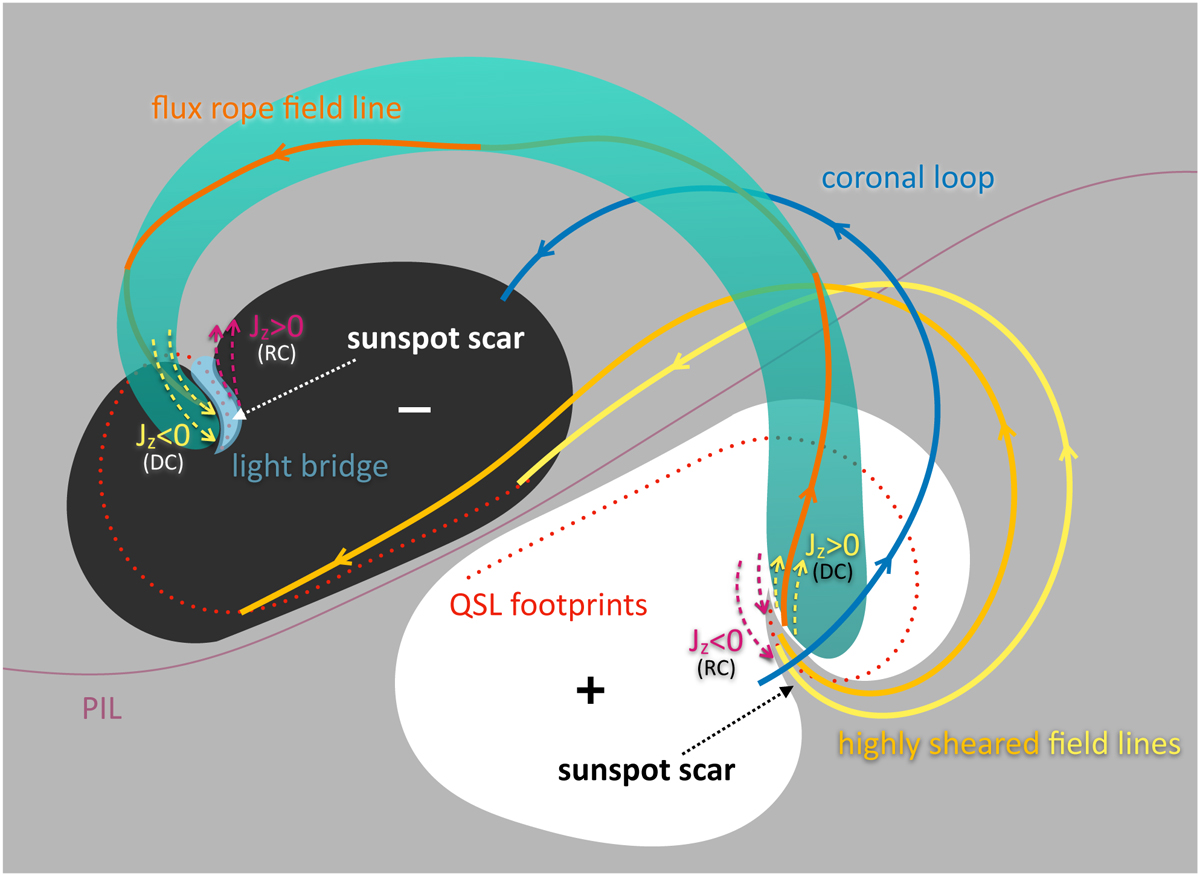
Sketch of the sunspot scar. The white and black regions represent the positive and negative polarities in an active region, respectively, which are separated by the PIL (the purple solid curve). The sunspot scars are shown as the arc-shaped intrusions in the positive and negative polarities. We only show the light bridge which is co-spatial with the sunspot scar in the negative polarity, while the light bridge could also appear in the positive one although not shown. In the positive polarity, we show the flux rope (represented by the green tube and also the dark orange field line in it) anchored at the inner side of the sunspot scar, the coronal loop (blue field line) rooted at the outer side, and the highly sheared field lines (light orange and yellow field lines) whose one footpoint is in the sunspot scar and the other one is on the QSL footprints (shown by the red dashed curves) in the other polarity. Similarly, the above field lines also exist around the sunspot scar in the negative polarity although not shown. The yellow and purple dashed arrows at two sides of the sunspot scars represent the direct current (DC) in the forward-S flux rope and the return current (RC) in the shielding background coronal loops, respectively.
Current usage metrics show cumulative count of Article Views (full-text article views including HTML views, PDF and ePub downloads, according to the available data) and Abstracts Views on Vision4Press platform.
Data correspond to usage on the plateform after 2015. The current usage metrics is available 48-96 hours after online publication and is updated daily on week days.
Initial download of the metrics may take a while.