Fig. 12
Download original image
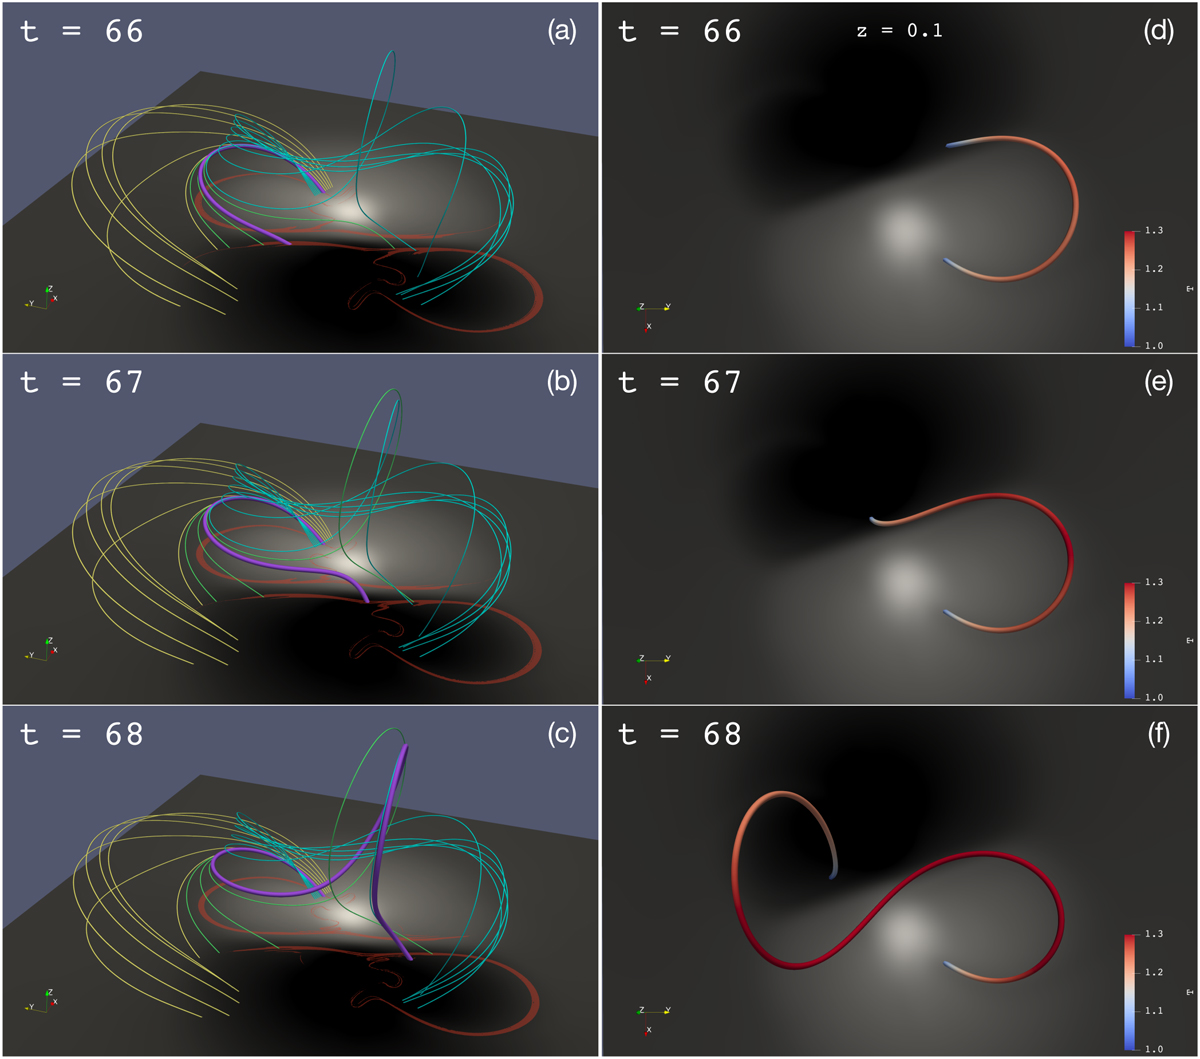
Snapshots of field lines traced from points on a slit crossing through the sunspot scar in the positive polarity during 66 ≤ t ≤ 68 in “Simulation 2”. The bottom plane in each sub-panel exhibits the vertical magnetic field strength on the plane z = 0.1. In panels a–c, the thin yellow, green and blue tubes represent the field lines traced from points on a slit which is along the slit in Fig. 10; the thick purple tube represents the field line which is traced from a fixed point at the bottom plane (z = 0.015) and crosses through the plane z = 0.1 with the intersection in the sunspot scar and on the slit. The red filled contours show the QSLs footprints on the plane z = 0.1. Panels d–f show the top view of panels a–c, with only the plane z = 0.1 and the thick tube (same as the purple tube in panels a–c) exhibited. The color of the tube shows the temperature along the field line.
Current usage metrics show cumulative count of Article Views (full-text article views including HTML views, PDF and ePub downloads, according to the available data) and Abstracts Views on Vision4Press platform.
Data correspond to usage on the plateform after 2015. The current usage metrics is available 48-96 hours after online publication and is updated daily on week days.
Initial download of the metrics may take a while.