Fig. 11
Download original image
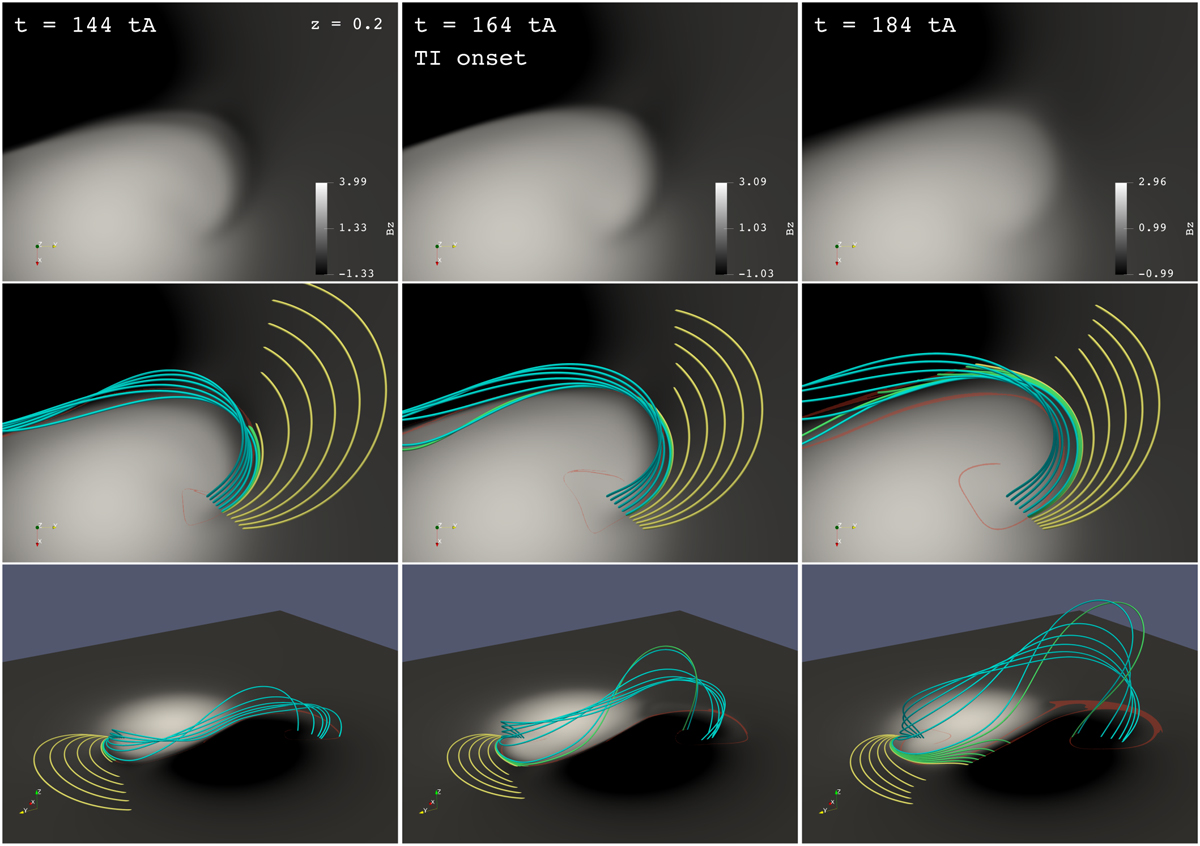
Snapshots of sunspot scars and the field lines traced from points along a slit crossing through the sunspot scar in the positive polarity at t = 144 tA (first column), t = 164 tA (second column), and t = 184 tA (third column) in “Simulation 1.” The bottom plane in each sub-panel shows the vertical magnetic field on the plane z = 0.2, clearly exhibiting the sunspot scar in the positive polarity. The tubes in the second row represent the field lines traced from points on a slit which is along the slit in Fig. 8. The blue tubes represent the flux rope field lines anchored at the inner side of the sunspot scar, the yellow tubes represent the inclined loops anchored at the outer side, and the green tubes represent the field lines which are anchored in the scar and at the transition between the previous two bunches of field lines. The red filled contours show the QSLs footprints on the plane z = 0.2. The third row is the oblique view of the second row.
Current usage metrics show cumulative count of Article Views (full-text article views including HTML views, PDF and ePub downloads, according to the available data) and Abstracts Views on Vision4Press platform.
Data correspond to usage on the plateform after 2015. The current usage metrics is available 48-96 hours after online publication and is updated daily on week days.
Initial download of the metrics may take a while.