Fig. 10
Download original image
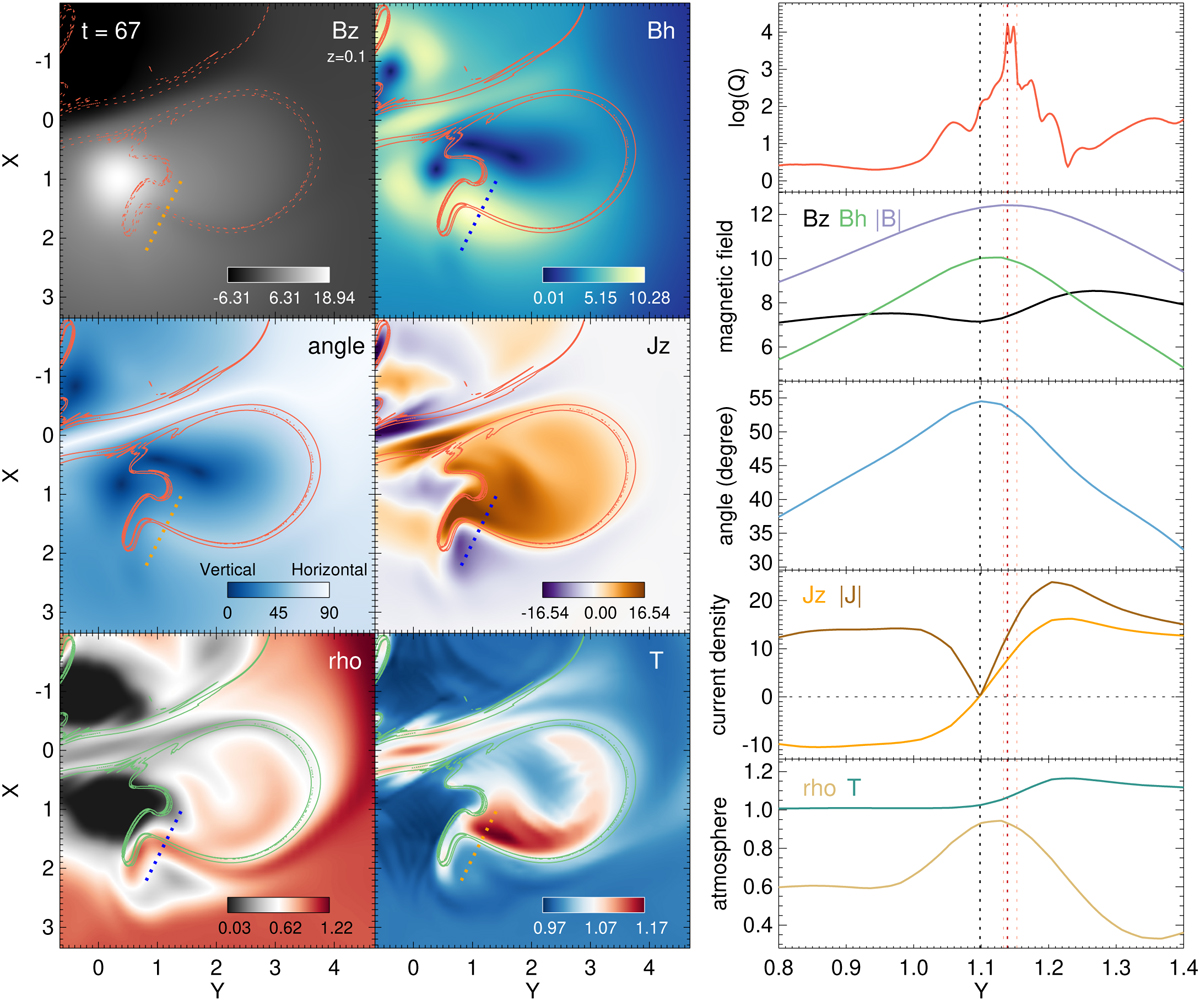
Properties of the sunspot scar in the positive polarity of “Simulation 2”, shown by the 2D images (left half) and 1D plots of slit crossing through the scar (right half). Left half: Distributions of vertical magnetic field strength (Bz), horizontal magnetic field strength (Bh), inclination angle (angle), vertical current density (Jz), mass density (rho), and temperature (T) on the plane z = 0.1 at t = 67 in “Simulation 2.” The red (or green) solid (or dashed) contours outline the QSL footprints on this plane. Right half: 1D plots along the slit crossing through the sunspot scar at t = 67 (orange and blue dashed lines in the left half). From the top to the bottom, they are squashing degree (logQ), total magnetic field strength (|B|), horizontal magnetic field strength (Bh), vertical magnetic field strength (Bz), inclination angle, total current density (|J|), vertical current density (Jz), temperature (T), and mass density (rho). The red dashed line shows the peak of logQ, and the pink dashed lines demonstrate the range of the QSL footprint (logQ ≥ 3). The black vertical dashed line marks the dip of Bz in the sunspot scar. The black horizontal dashed line in the fourth row marks the value where the current density equals zero. A movie of this figure is available online.
Current usage metrics show cumulative count of Article Views (full-text article views including HTML views, PDF and ePub downloads, according to the available data) and Abstracts Views on Vision4Press platform.
Data correspond to usage on the plateform after 2015. The current usage metrics is available 48-96 hours after online publication and is updated daily on week days.
Initial download of the metrics may take a while.