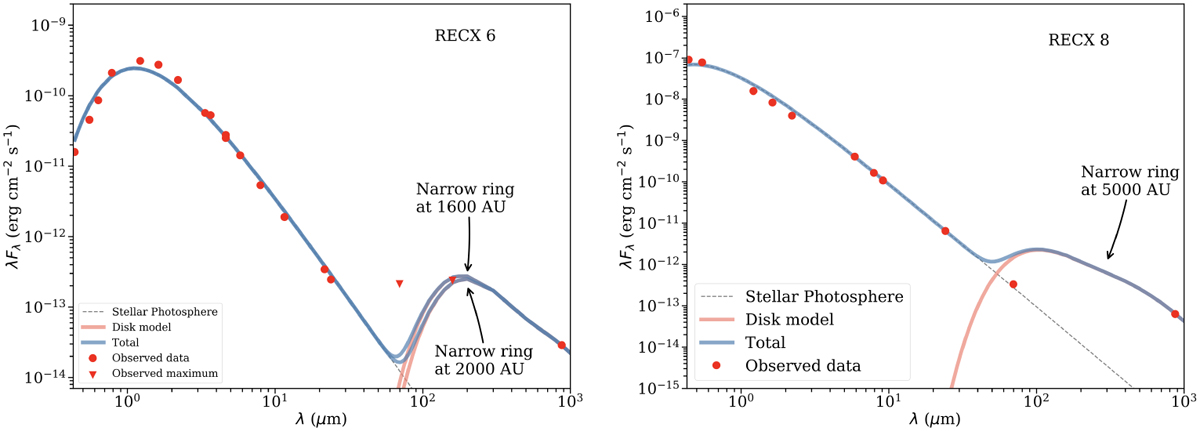
Fig. A.2
Download original image
Tentative SED models for the debris disks. The photometry data are shown as red circles and red triangles (upper limits). Stellar photospheric, disk, and total emission (stellar photospheric + disk models) are respectively represented by gray dotted lines, and red and blue continuous lines; however, none are able to reproduce all the observed data well.
Current usage metrics show cumulative count of Article Views (full-text article views including HTML views, PDF and ePub downloads, according to the available data) and Abstracts Views on Vision4Press platform.
Data correspond to usage on the plateform after 2015. The current usage metrics is available 48-96 hours after online publication and is updated daily on week days.
Initial download of the metrics may take a while.