Fig. 7
Download original image
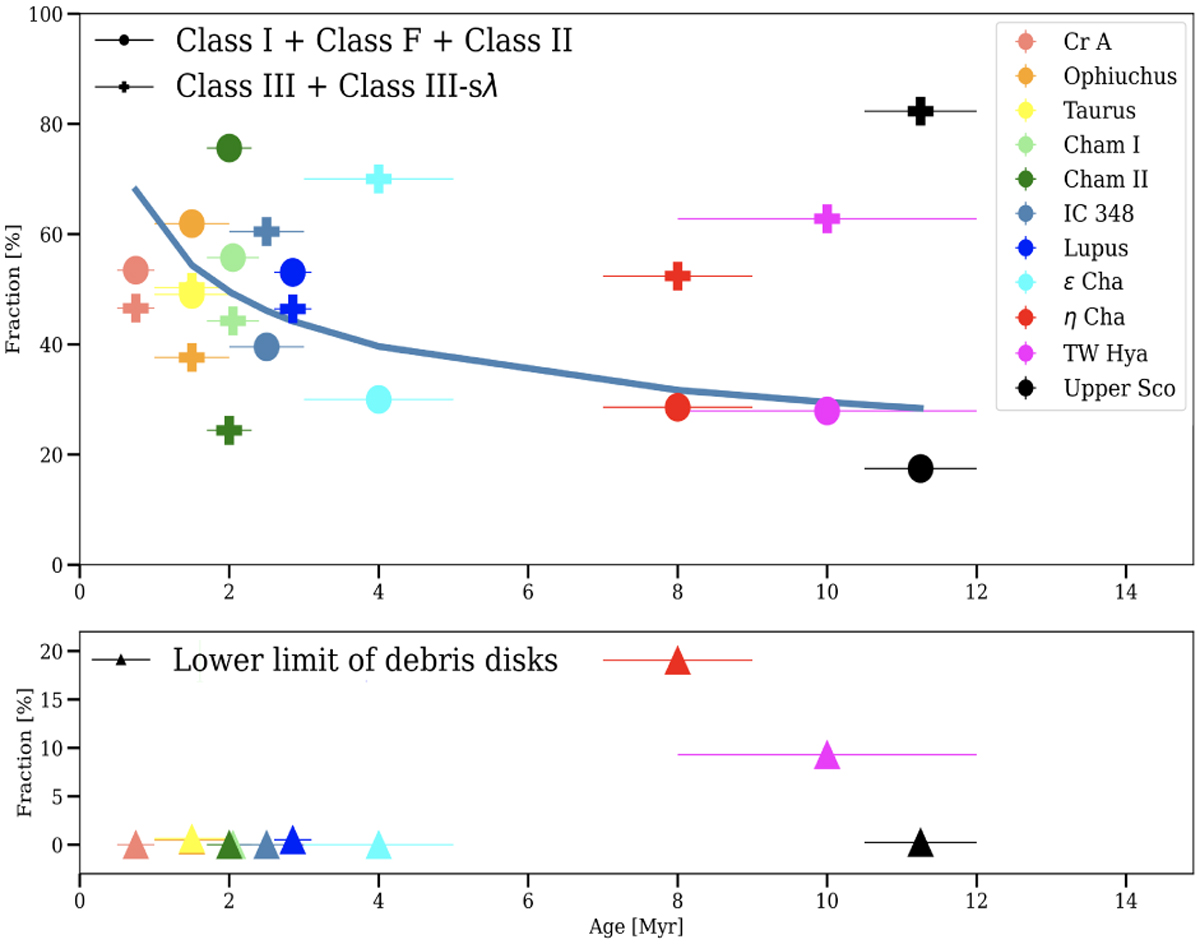
Relation in several young star-forming regions between disk fraction and their age. The fraction of Class I + Class F + Class II disks is shown as filled dots, while the fraction of Class III disks is shown as crosses. Each star-forming region is color-coded according to the legend. The filled triangles in the lower panel represent the lower limits of the debris disk fraction. The blue line represents the fitting of the fraction of Class I + Class F + Class II disks, with a slope of −0.32 ± 0.11.
Current usage metrics show cumulative count of Article Views (full-text article views including HTML views, PDF and ePub downloads, according to the available data) and Abstracts Views on Vision4Press platform.
Data correspond to usage on the plateform after 2015. The current usage metrics is available 48-96 hours after online publication and is updated daily on week days.
Initial download of the metrics may take a while.