Fig. 5
Download original image
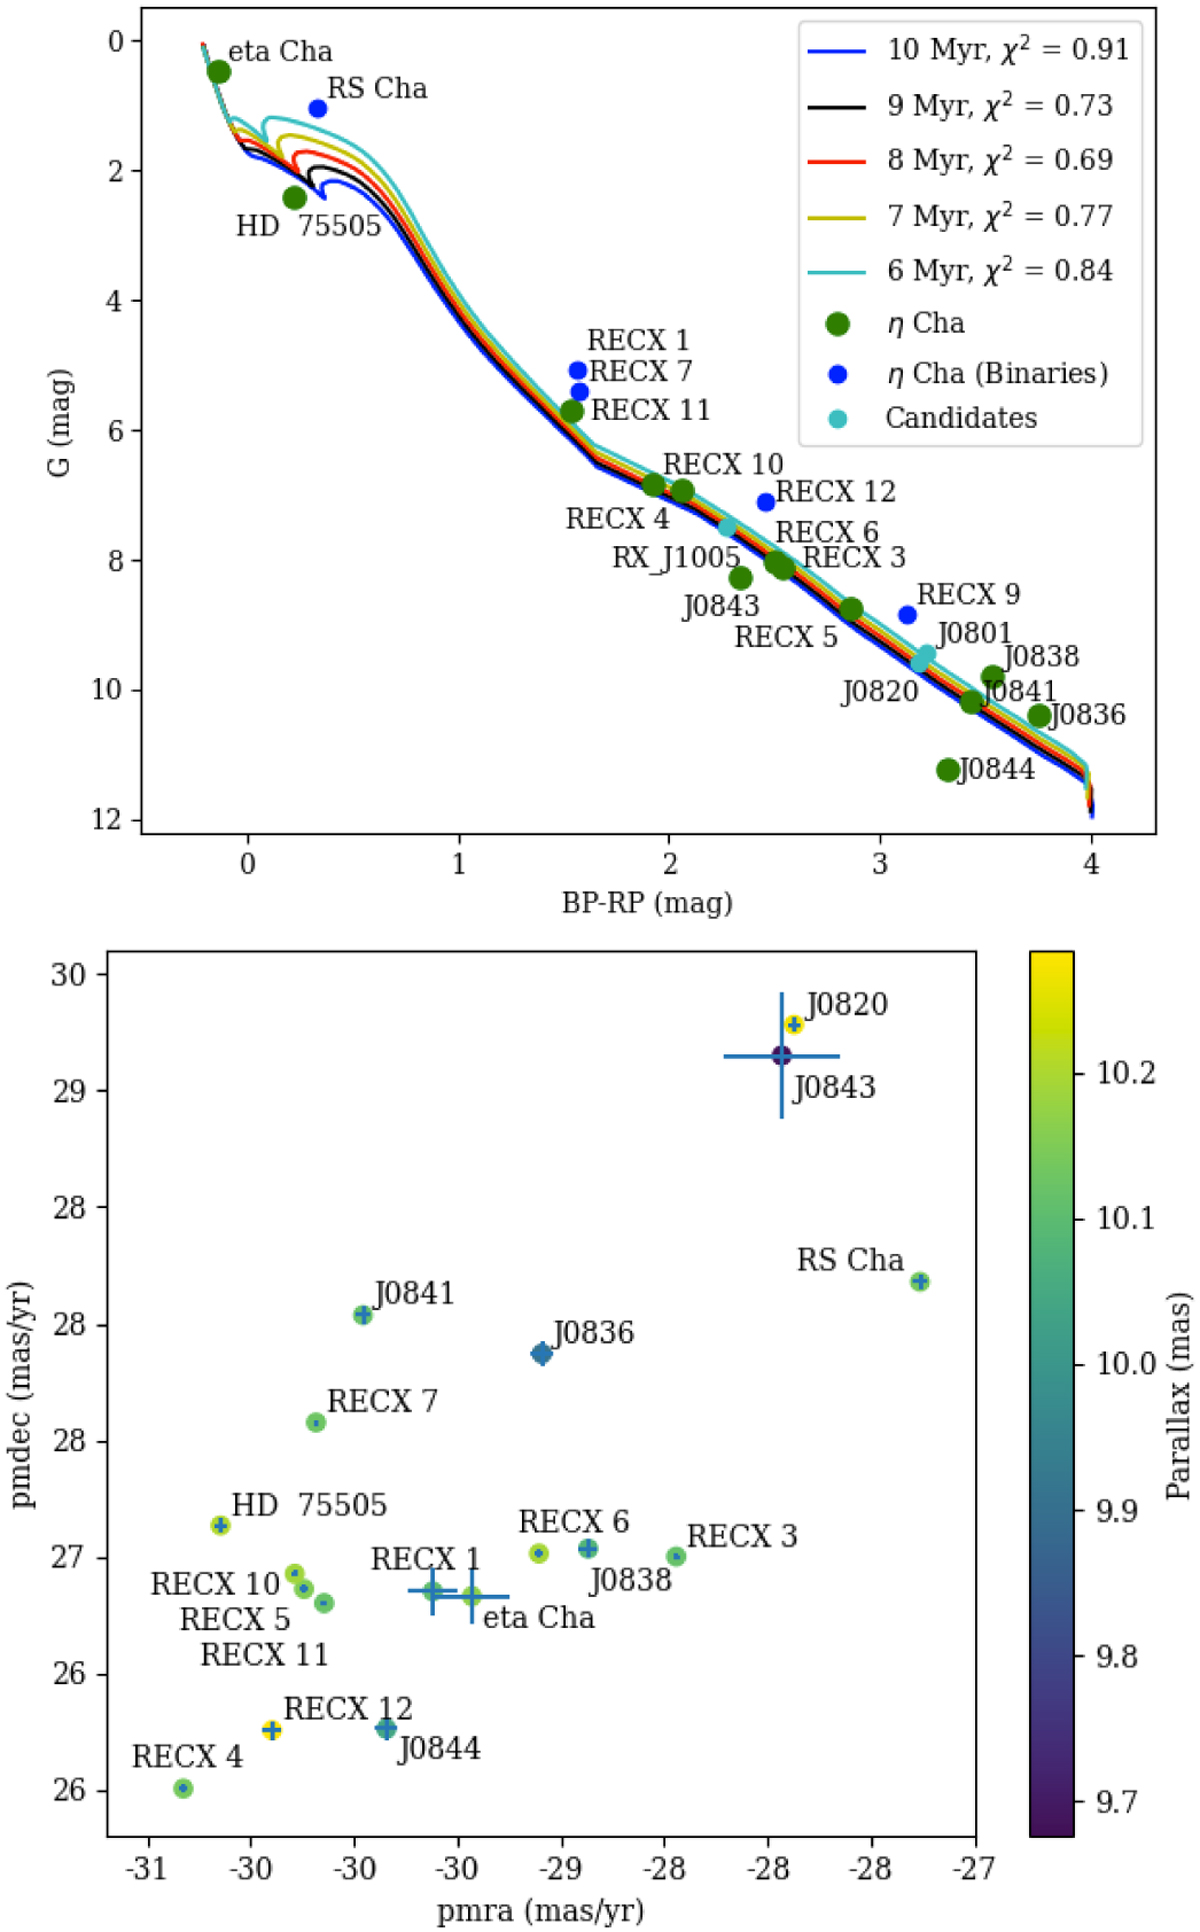
Gaia eDR3 photometry and astrometry of η Cha. Top: colour-magnitude diagram of the η Cha association members from Gaia eDR3 photometry. The isochrones are overplotted and the determined x2 values are shown in the legend, each with p values > 9e6. The confirmed binaries, as indicated in Table A.1 are not included in the x2 calculations. Bottom: proper motion plot from Gaia eDR3 astrometry. Markers are color-coded by the star’s parallax (see color bar at right). RX J1005 (−38,15) and J0801 (−19,29) are not shown.
Current usage metrics show cumulative count of Article Views (full-text article views including HTML views, PDF and ePub downloads, according to the available data) and Abstracts Views on Vision4Press platform.
Data correspond to usage on the plateform after 2015. The current usage metrics is available 48-96 hours after online publication and is updated daily on week days.
Initial download of the metrics may take a while.