Fig. 4
Download original image
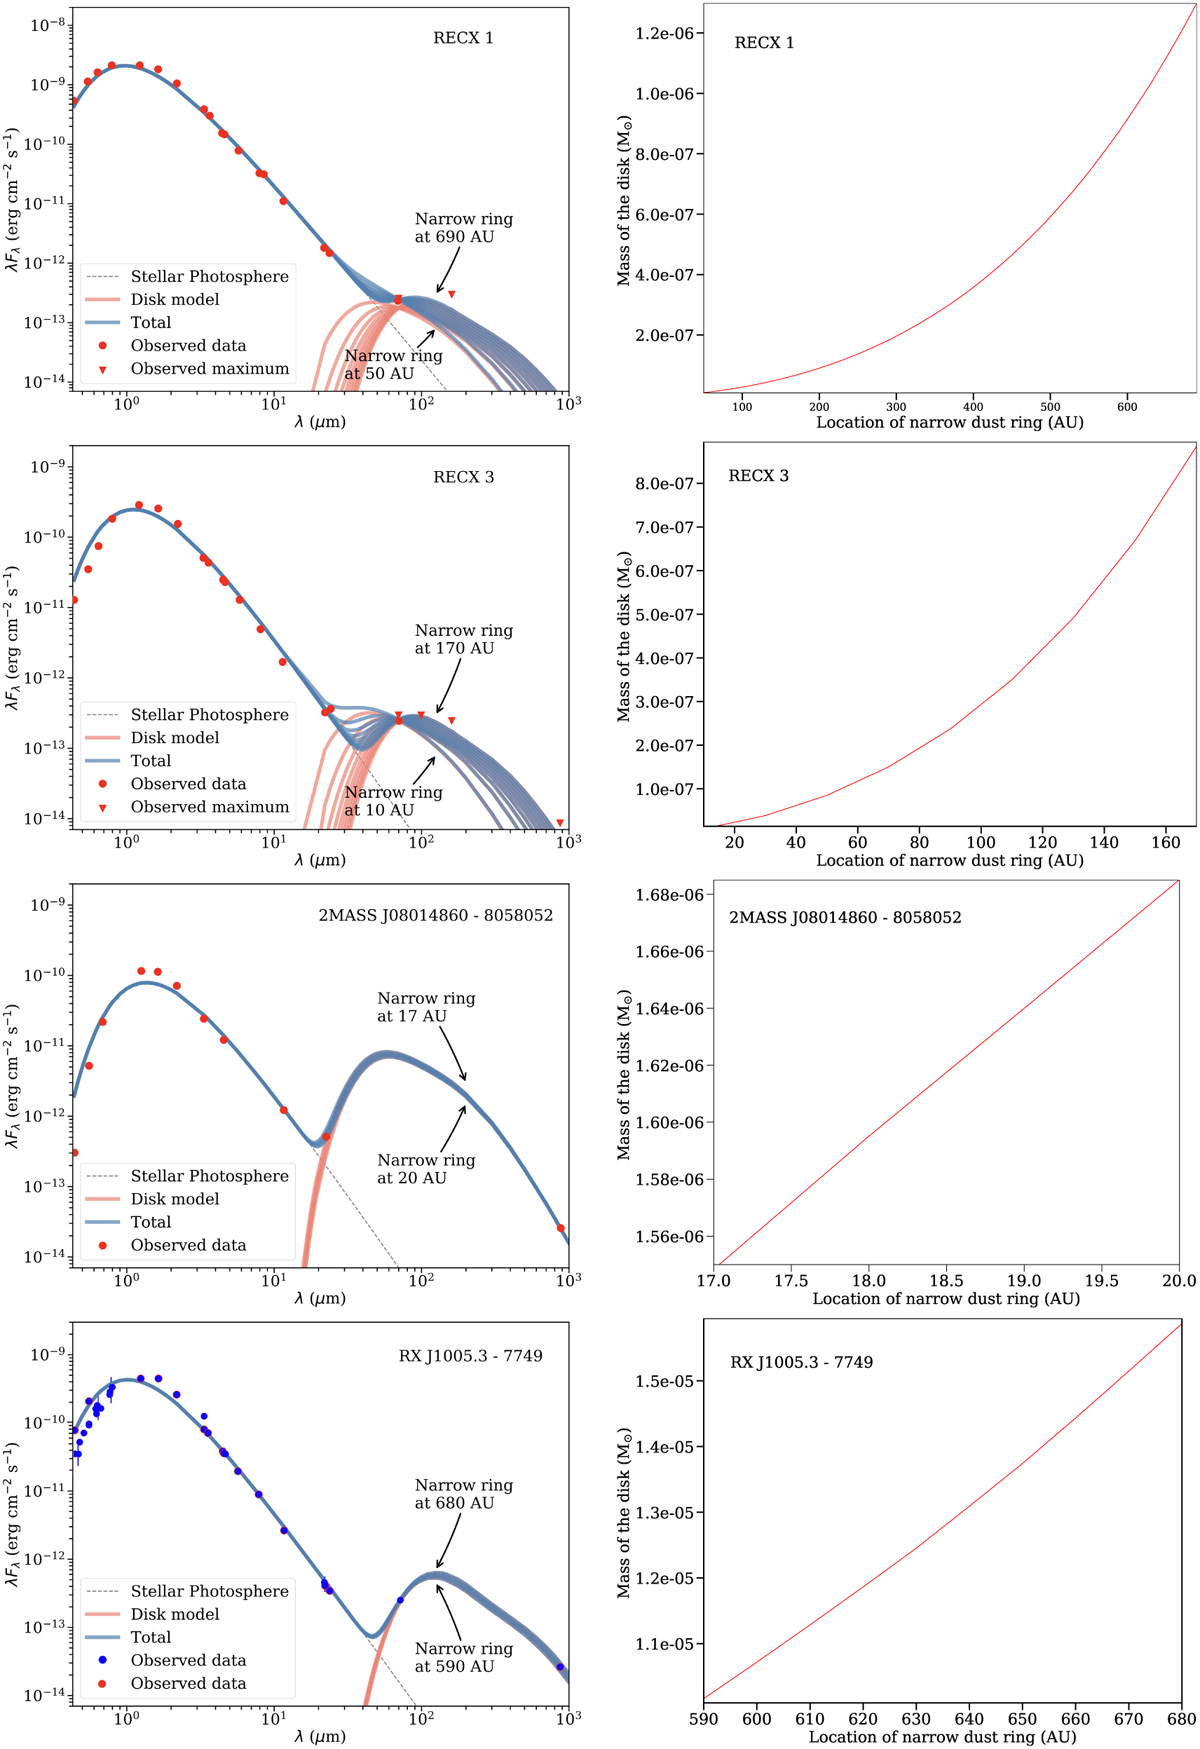
SED models for the debris disks. Left: the photometry data are shown as red circles and triangles (upper limits). Stellar photospheric, disk, and total emission (stellar photospheric + disk models) are represented by gray dotted lines, and red and blue continuous lines, respectively (see Table 2 for details on individual models). The blue dots in the SED of RX J1005.3-7749 show the detection from Murphy et al. (2010). Right: results of the SED modeling of the debris disks showing the mass of the disk as a function of the location of the narrow dust ring.
Current usage metrics show cumulative count of Article Views (full-text article views including HTML views, PDF and ePub downloads, according to the available data) and Abstracts Views on Vision4Press platform.
Data correspond to usage on the plateform after 2015. The current usage metrics is available 48-96 hours after online publication and is updated daily on week days.
Initial download of the metrics may take a while.