Fig. 1
Download original image
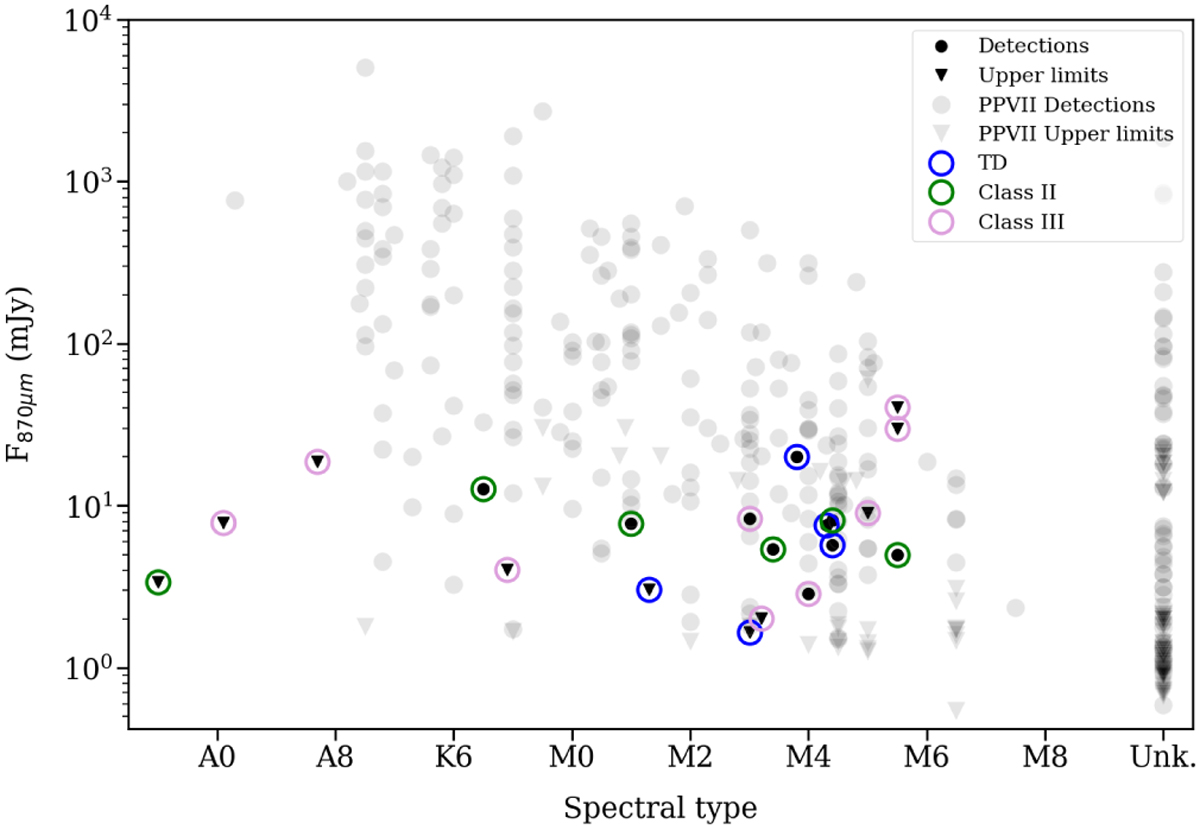
APEX flux versus spectral type for the η Cha members. For comparison, the objects in the list from Manara et al. (2023) are shown in gray, scaled to the distance of η Cha. Note the lack of significant correlations between these quantities. Filled dots represent flux detections, while inverted triangles show upper limits. An additional color ring is added to specify the type of disk according to the classical SED classification adopted by Sicilia-Aguilar et al. (2009): transitional disks (TD), Class II, and Class III (including the debris disks). RS Cha and η Cha are considered as upper limits due to cloud contamination.
Current usage metrics show cumulative count of Article Views (full-text article views including HTML views, PDF and ePub downloads, according to the available data) and Abstracts Views on Vision4Press platform.
Data correspond to usage on the plateform after 2015. The current usage metrics is available 48-96 hours after online publication and is updated daily on week days.
Initial download of the metrics may take a while.