Fig. 5
Download original image
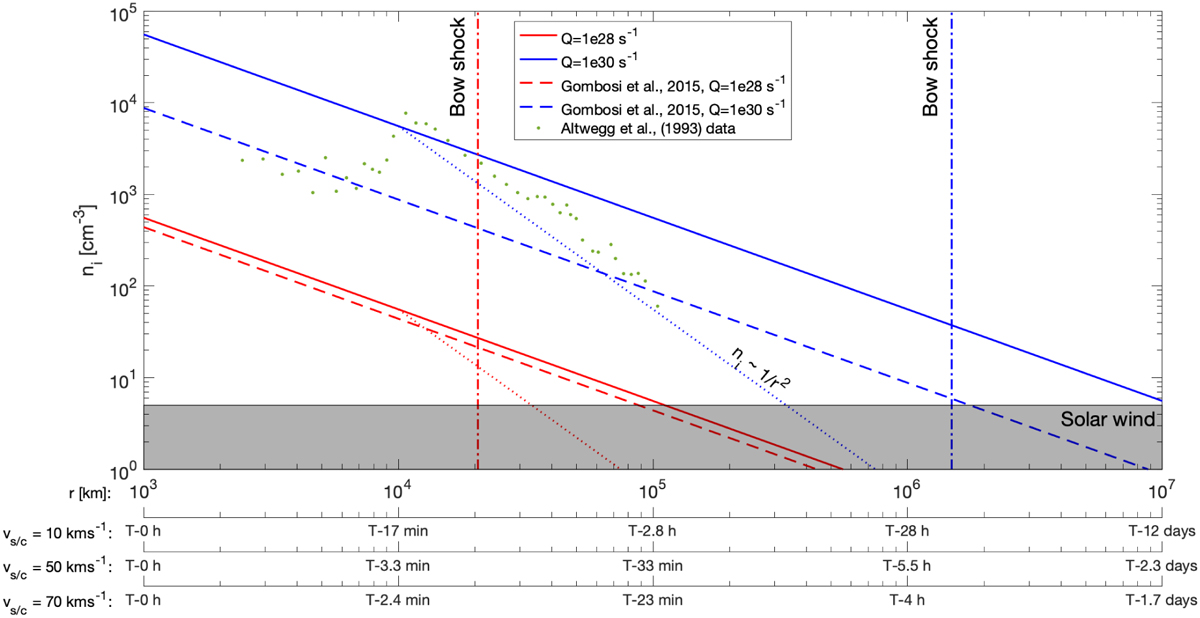
Ionospheric density as a function of cometocentric distance from two models (solid and dashed lines, see text) and assuming that the density starts to decrease as 1/r2 at 104 km. The density is calculated for two outgassing rates (red and blue). The bow shock distance at the terminator (which is roughly twice the subsolar standoff distance) for the two outgassing rates is indicated (vertical dash-dotted lines). The grey shaded region indicates the solar wind density at 1 AU. The ion density measured by Giotto at comet 1P/Halley is also included (green dots).
Current usage metrics show cumulative count of Article Views (full-text article views including HTML views, PDF and ePub downloads, according to the available data) and Abstracts Views on Vision4Press platform.
Data correspond to usage on the plateform after 2015. The current usage metrics is available 48-96 hours after online publication and is updated daily on week days.
Initial download of the metrics may take a while.