Fig. 1
Download original image
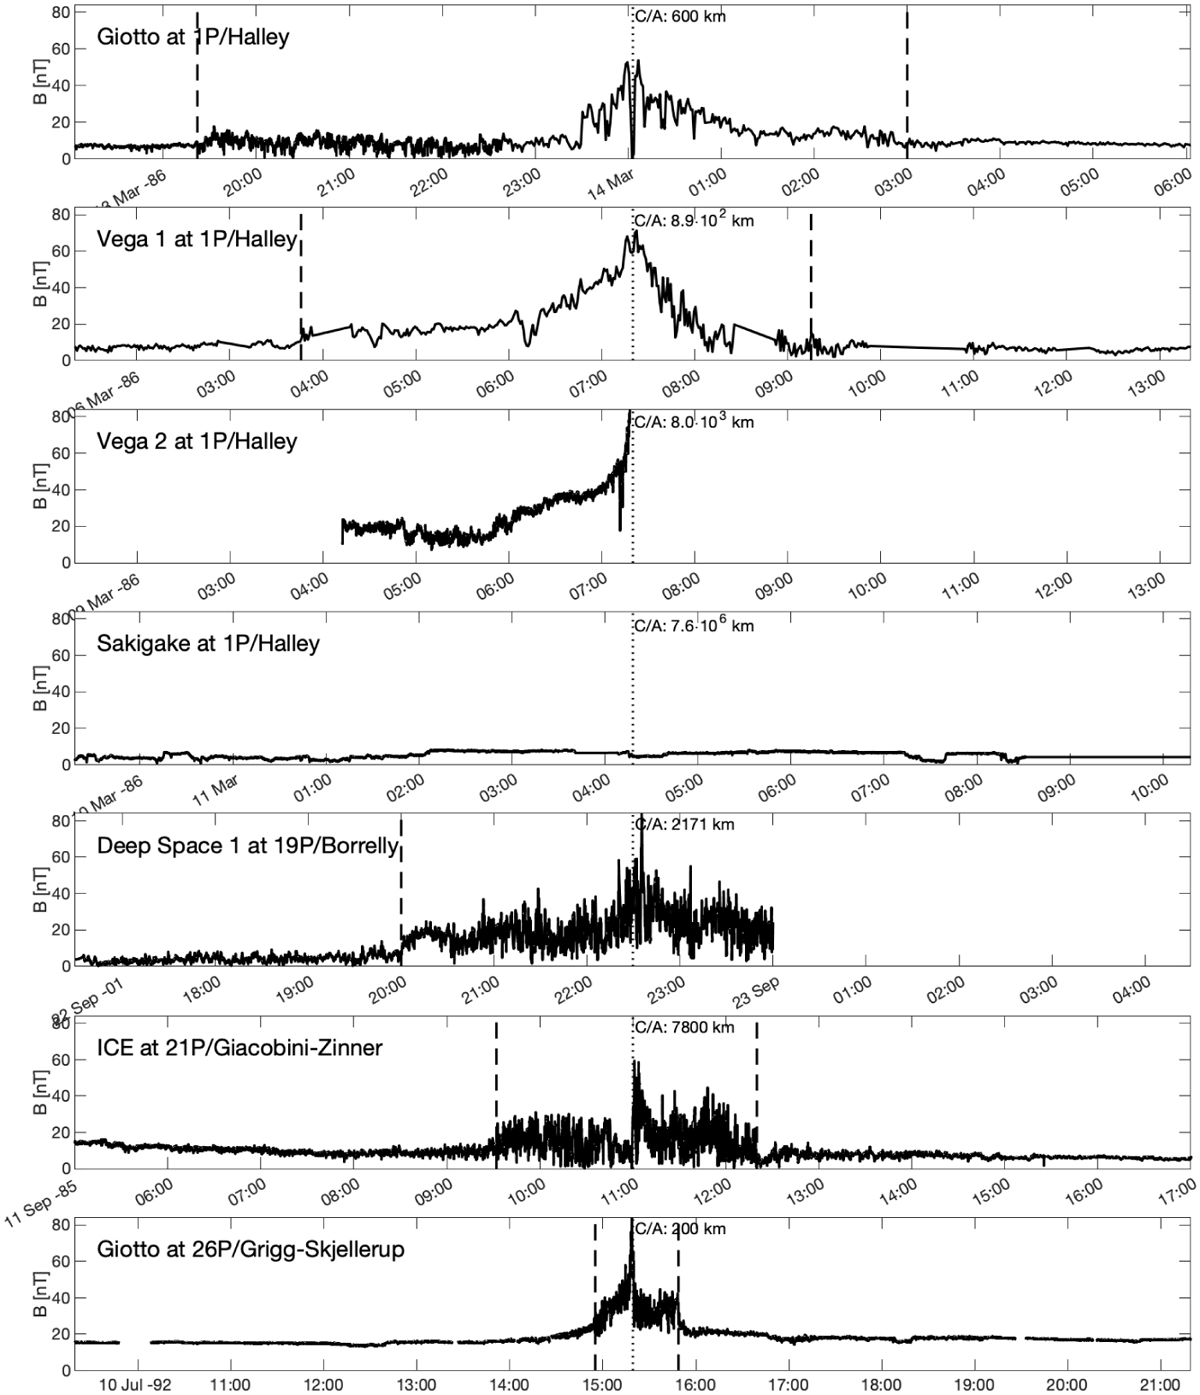
Time series of magnetic field data during previous cometary flybys. The vertical dashed lines indicate the times of bow shock crossings, and the dotted lines represent the time of closest approach. The flybys (panels) are ordered in decreasing time spent within the respective plasma environment. Vega 2 did not observe the actual bow shock crossing with its magnetometer, and the distance of Sakigake at the flyby was too large for it to enter the plasma environment. The Suisei spacecraft did not carry a magnetometer and is therefore not included in this plot.
Current usage metrics show cumulative count of Article Views (full-text article views including HTML views, PDF and ePub downloads, according to the available data) and Abstracts Views on Vision4Press platform.
Data correspond to usage on the plateform after 2015. The current usage metrics is available 48-96 hours after online publication and is updated daily on week days.
Initial download of the metrics may take a while.