Open Access
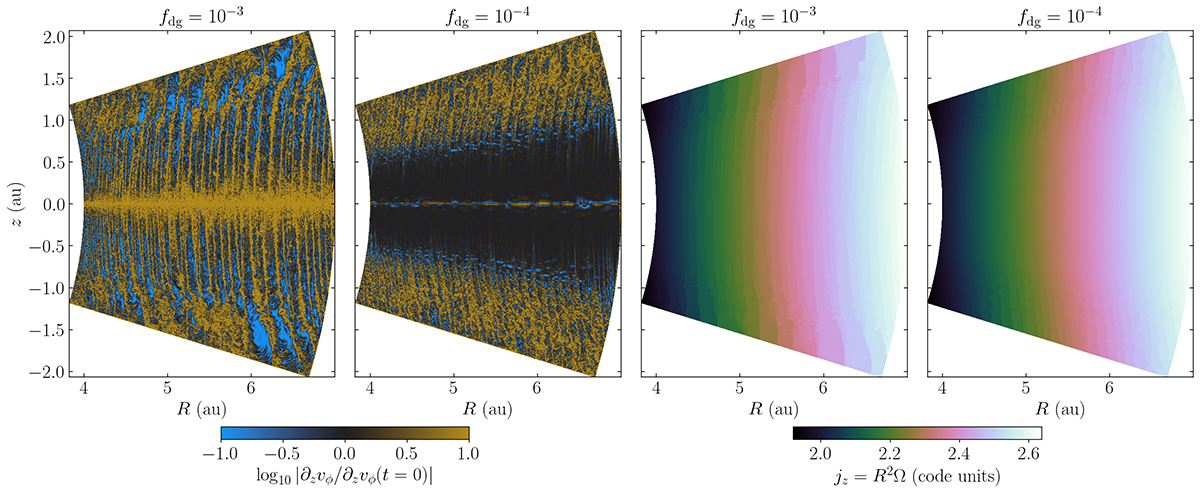
Fig. 6.
Download original image
Vertical shear and angular momentum. Left panels: comparison between the vertical shear at t = 0 and t = 300 orbits in the highest-resolution runs. Right panels: corresponding specific angular momentum distributions after 300 orbits.
Current usage metrics show cumulative count of Article Views (full-text article views including HTML views, PDF and ePub downloads, according to the available data) and Abstracts Views on Vision4Press platform.
Data correspond to usage on the plateform after 2015. The current usage metrics is available 48-96 hours after online publication and is updated daily on week days.
Initial download of the metrics may take a while.