Open Access
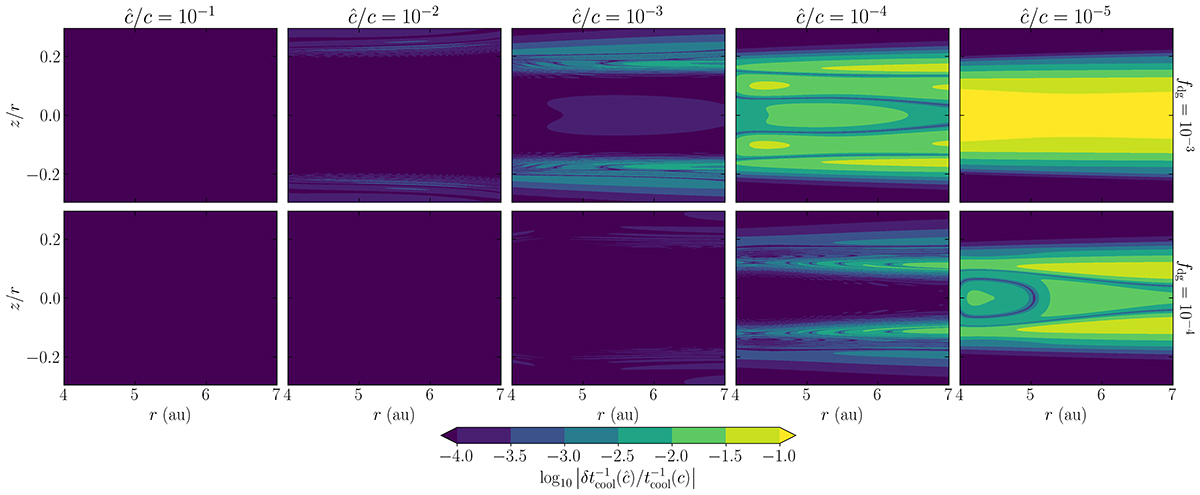
Fig. B.1.
Download original image
Relative variation of the cooling rate with respect to its value when ![]() as a function of
as a function of ![]() for fdg = 10−3 (top row) and 10−4 (bottom row).
for fdg = 10−3 (top row) and 10−4 (bottom row).
Current usage metrics show cumulative count of Article Views (full-text article views including HTML views, PDF and ePub downloads, according to the available data) and Abstracts Views on Vision4Press platform.
Data correspond to usage on the plateform after 2015. The current usage metrics is available 48-96 hours after online publication and is updated daily on week days.
Initial download of the metrics may take a while.