Open Access
Fig. 17.
Download original image
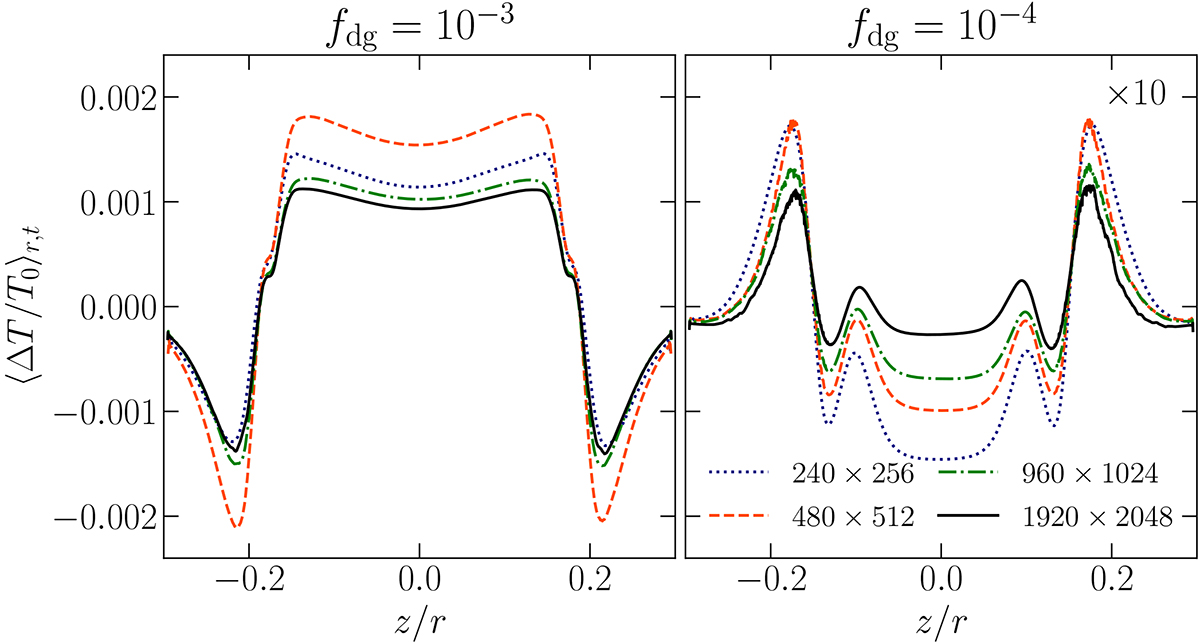
Radially averaged relative temperature variation for all employed resolutions and fdg values. Displayed values have been averaged in time between 285 and 300 orbits to get rid of fluctuations. The values for fdg = 10−4 have been multiplied by 10 to facilitate the comparison.
Current usage metrics show cumulative count of Article Views (full-text article views including HTML views, PDF and ePub downloads, according to the available data) and Abstracts Views on Vision4Press platform.
Data correspond to usage on the plateform after 2015. The current usage metrics is available 48-96 hours after online publication and is updated daily on week days.
Initial download of the metrics may take a while.