Open Access
Fig. 2
Download original image
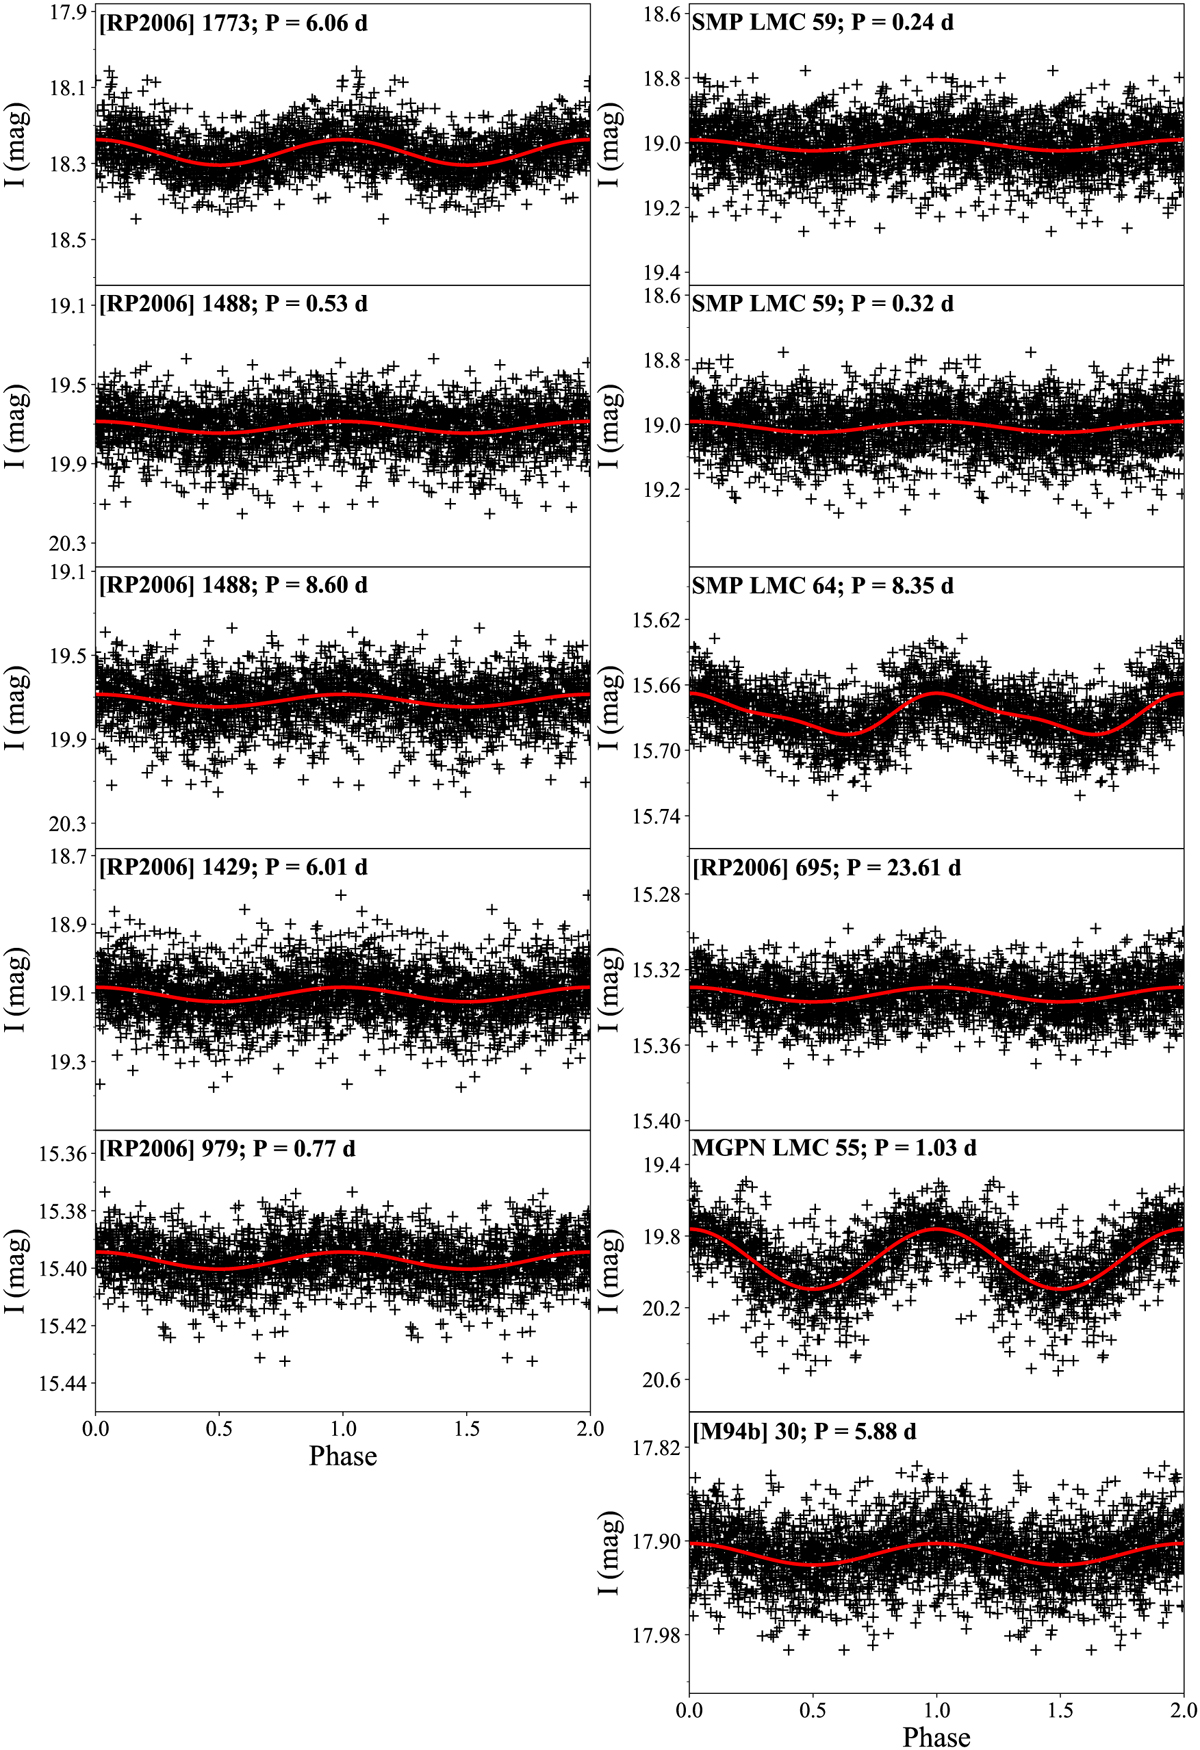
Phased OGLE I-band light curves of the LMC binary CSPNe identified in the top left corner of each panel. In the case of two PNe the light curve is also phased with the secondary period solution. The red line in each panel presents the fit to the data with the obtained period and amplitude.
Current usage metrics show cumulative count of Article Views (full-text article views including HTML views, PDF and ePub downloads, according to the available data) and Abstracts Views on Vision4Press platform.
Data correspond to usage on the plateform after 2015. The current usage metrics is available 48-96 hours after online publication and is updated daily on week days.
Initial download of the metrics may take a while.