Fig. 4
Download original image
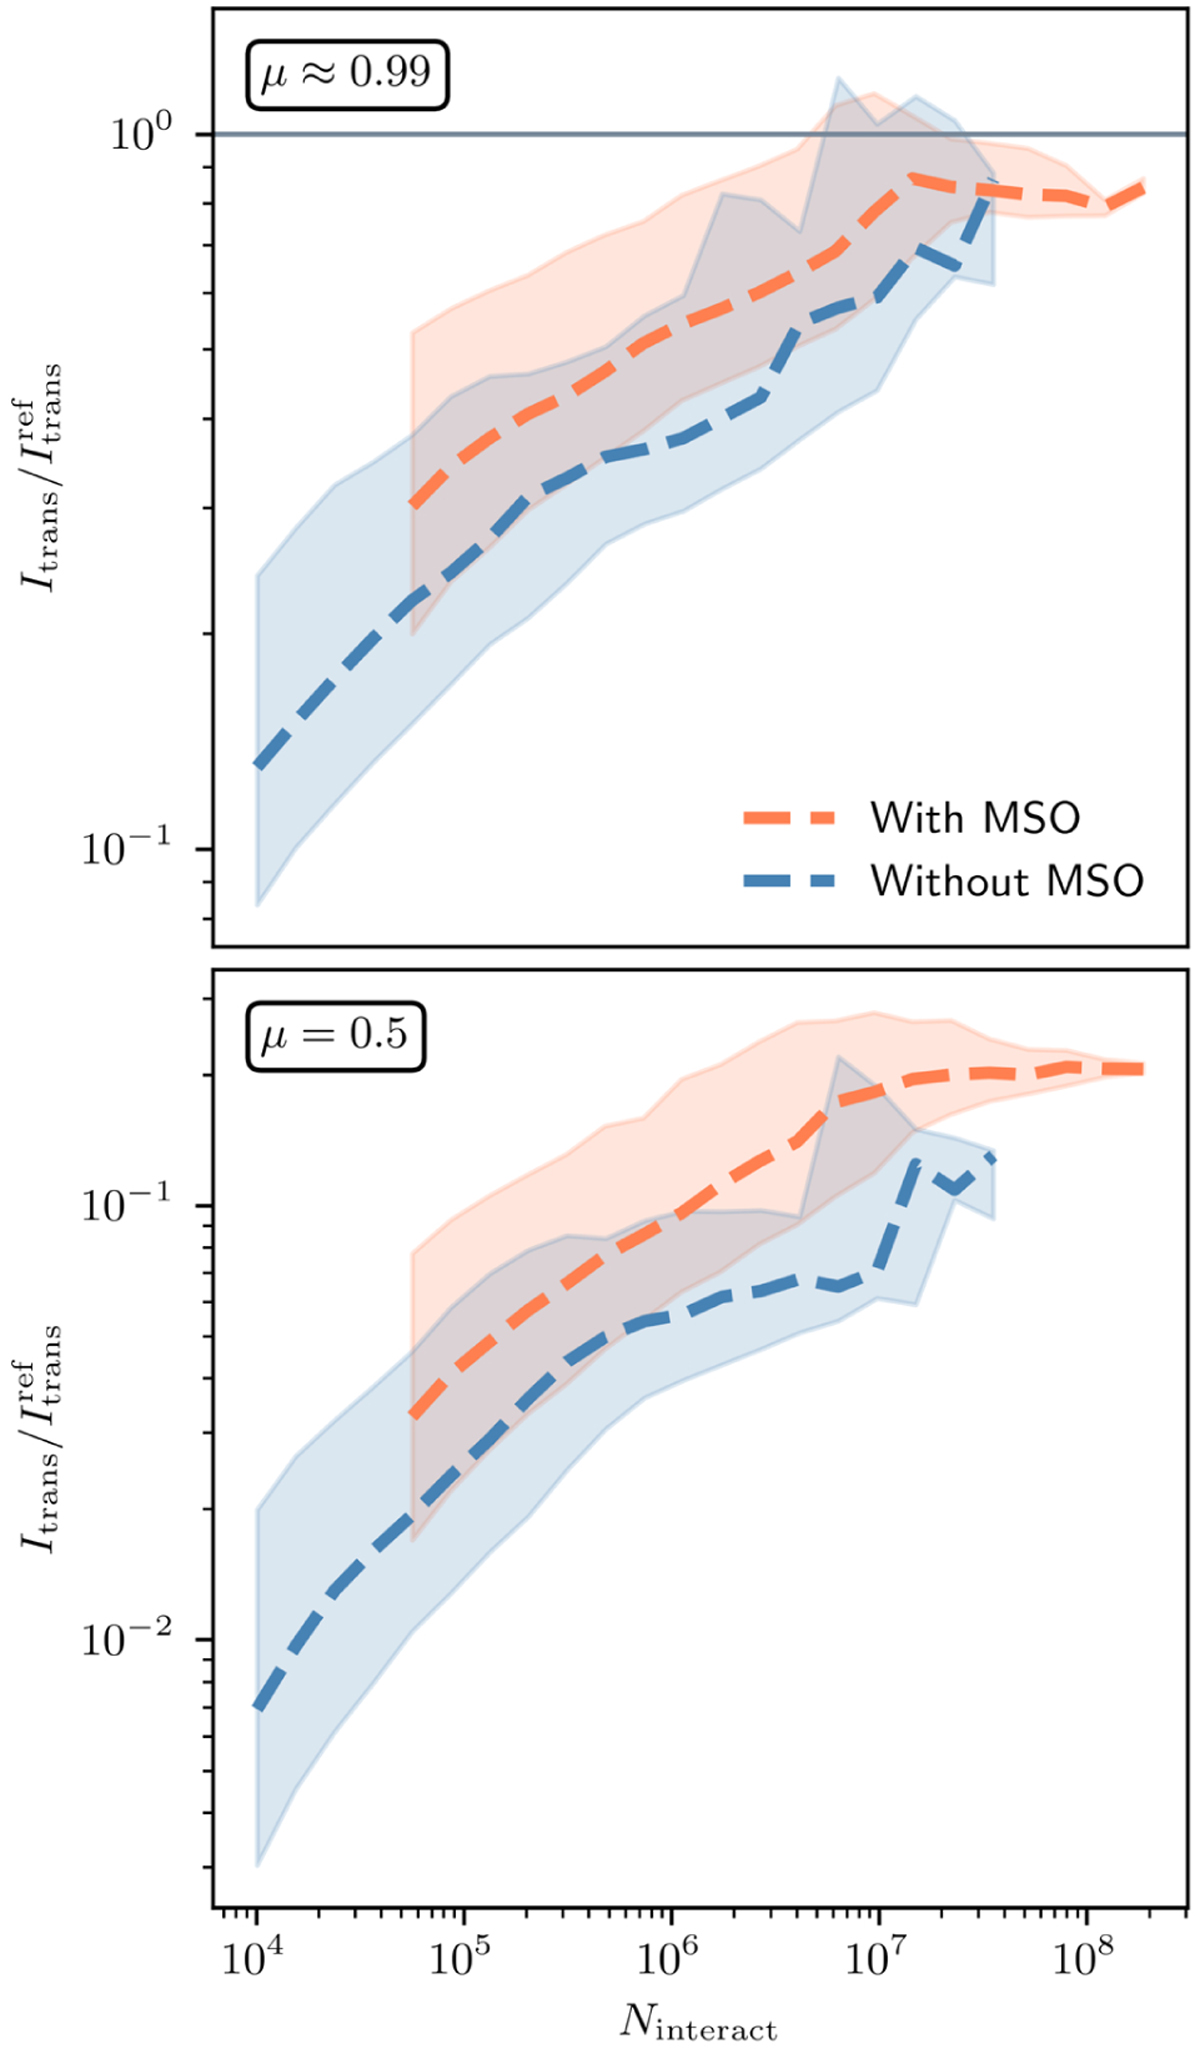
Ratio ![]() a function of the number of simulated interaction events Ninteract, where
a function of the number of simulated interaction events Ninteract, where ![]() denotes the value of the reference solution. The lines correspond to median curves, and the (color-coded) shaded areas encompass the central 50% of corresponding data points. The upper (lower) plot shows the results for a penetration direction of µ ≈ 0.99 (µ = 0.5).
denotes the value of the reference solution. The lines correspond to median curves, and the (color-coded) shaded areas encompass the central 50% of corresponding data points. The upper (lower) plot shows the results for a penetration direction of µ ≈ 0.99 (µ = 0.5).
Current usage metrics show cumulative count of Article Views (full-text article views including HTML views, PDF and ePub downloads, according to the available data) and Abstracts Views on Vision4Press platform.
Data correspond to usage on the plateform after 2015. The current usage metrics is available 48-96 hours after online publication and is updated daily on week days.
Initial download of the metrics may take a while.