Fig. 3
Download original image
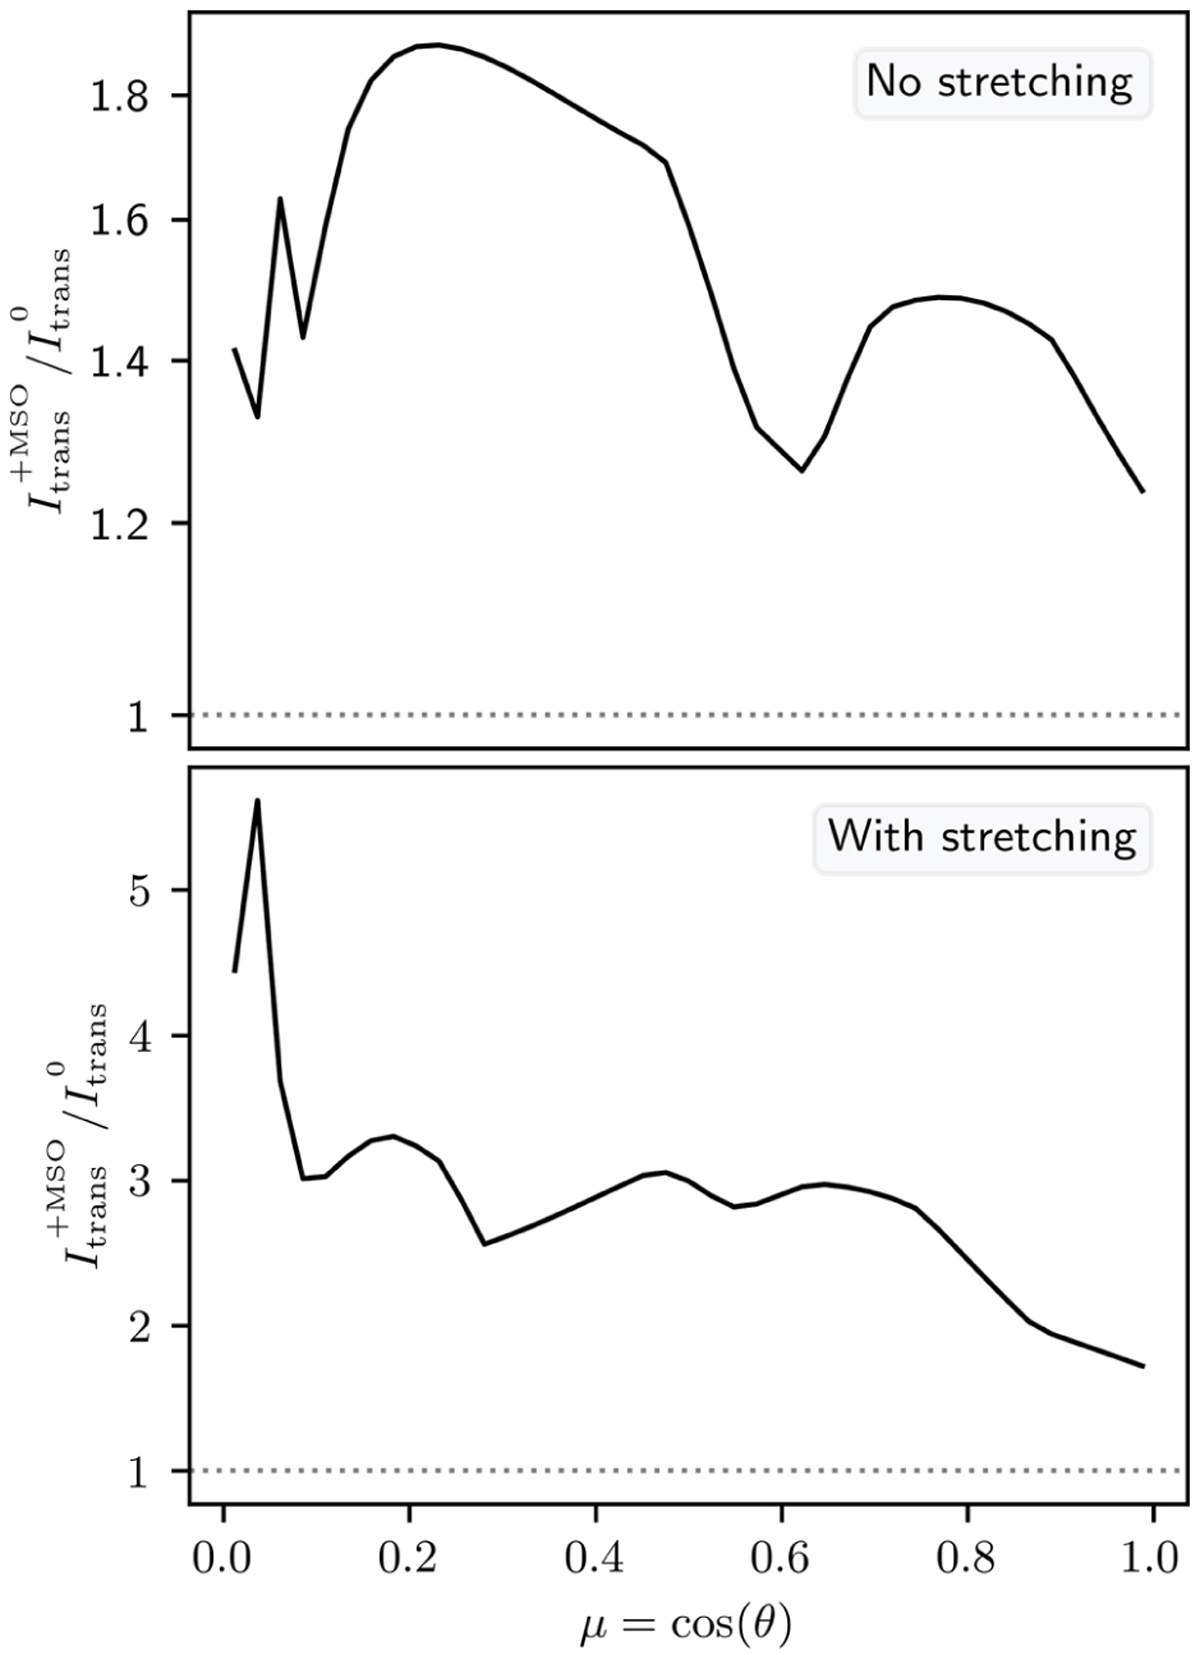
Ratios of transmission intensity curves ![]() as function of the direction of penetration µ, where
as function of the direction of penetration µ, where ![]() denotes the curve corresponding to simulations applying (not applying) the enforcement of a minimum scattering order. Values above one (gray dotted line) indicate a gain of intensity associated with the method. The upper (lower) plot shows the results for simulations that do not (do) additionally make use of a stretching method.
denotes the curve corresponding to simulations applying (not applying) the enforcement of a minimum scattering order. Values above one (gray dotted line) indicate a gain of intensity associated with the method. The upper (lower) plot shows the results for simulations that do not (do) additionally make use of a stretching method.
Current usage metrics show cumulative count of Article Views (full-text article views including HTML views, PDF and ePub downloads, according to the available data) and Abstracts Views on Vision4Press platform.
Data correspond to usage on the plateform after 2015. The current usage metrics is available 48-96 hours after online publication and is updated daily on week days.
Initial download of the metrics may take a while.