Fig. 2
Download original image
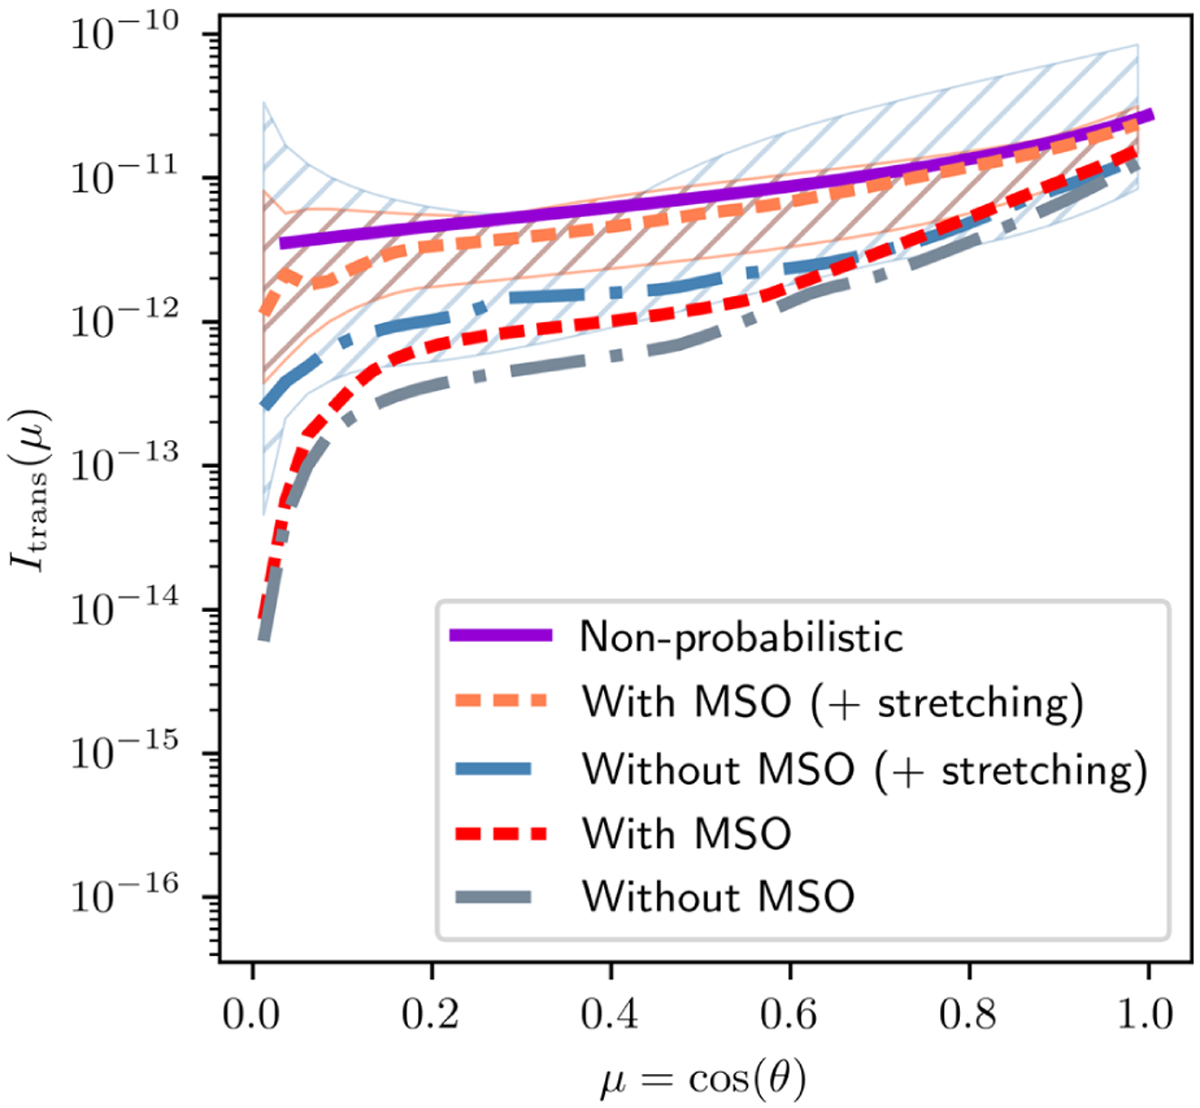
Results for the infinite plane-parallel slab experiment for an optical depth of τmax = 30 and an albedo of A = 0.7. Curves represent transmission intensities obtained by either a non-probabilistic method (purple) or MC based methods (dashed curves). The latter are additionally divided into four types, depending on their usage of advanced MCRT methods, such as the stretching method (stretching) or the enforcement of a minimum scattering order (MSO). The underlaid colored areas mark the regions of all simulated intensity curves, and dashed curves of the same color represent the corresponding medians.
Current usage metrics show cumulative count of Article Views (full-text article views including HTML views, PDF and ePub downloads, according to the available data) and Abstracts Views on Vision4Press platform.
Data correspond to usage on the plateform after 2015. The current usage metrics is available 48-96 hours after online publication and is updated daily on week days.
Initial download of the metrics may take a while.