Fig. 9.
Download original image
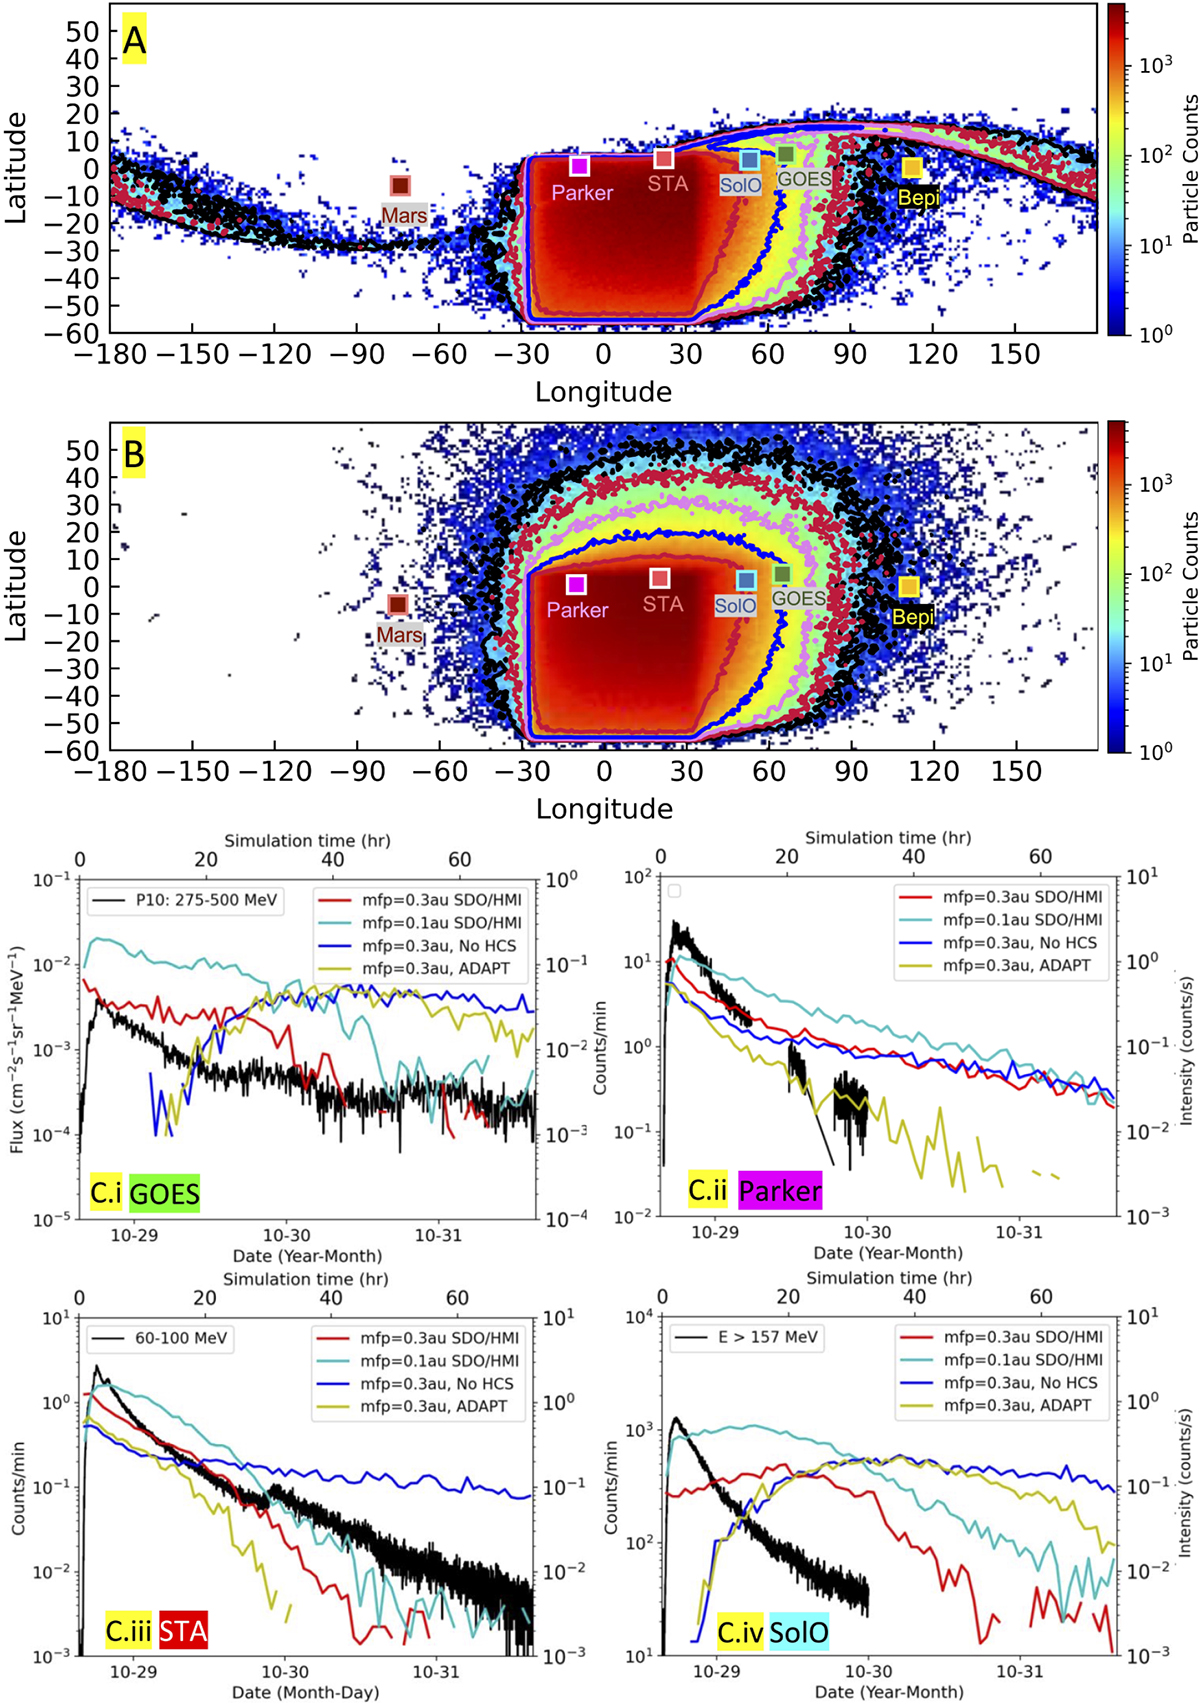
Results from the SEP modelling. Top panels (a): 1 au cumulative proton crossing map for 3D test particle simulation of GLE 73. The location of the HCS is from the SDO/HMI model, and the injection region is centred at the flare location, W02 S26. (b): Crossing map with HCS removed. Observer footpoints are as follows: Earth (blue square), SolO (green square), Mars (brown square), Parker (purple square), STA (red square), Bepi (yellow square). Bottom panels: (c) Observations (black) with simulation results for no HCS (blue), 60 × 60° injection for the SDO/HMI HCS and 0.3 au mean free path (red), 60 × 60° injection for the SDO/HMI HCS and 0.1 au mean free path (cyan), and 60 × 60° injection with 0.3 au mean free path for the ADAPT HCS (yellow). Observers shown in Ci–iv are for GOES, Parker Solar Probe, STA, and SolO.
Current usage metrics show cumulative count of Article Views (full-text article views including HTML views, PDF and ePub downloads, according to the available data) and Abstracts Views on Vision4Press platform.
Data correspond to usage on the plateform after 2015. The current usage metrics is available 48-96 hours after online publication and is updated daily on week days.
Initial download of the metrics may take a while.