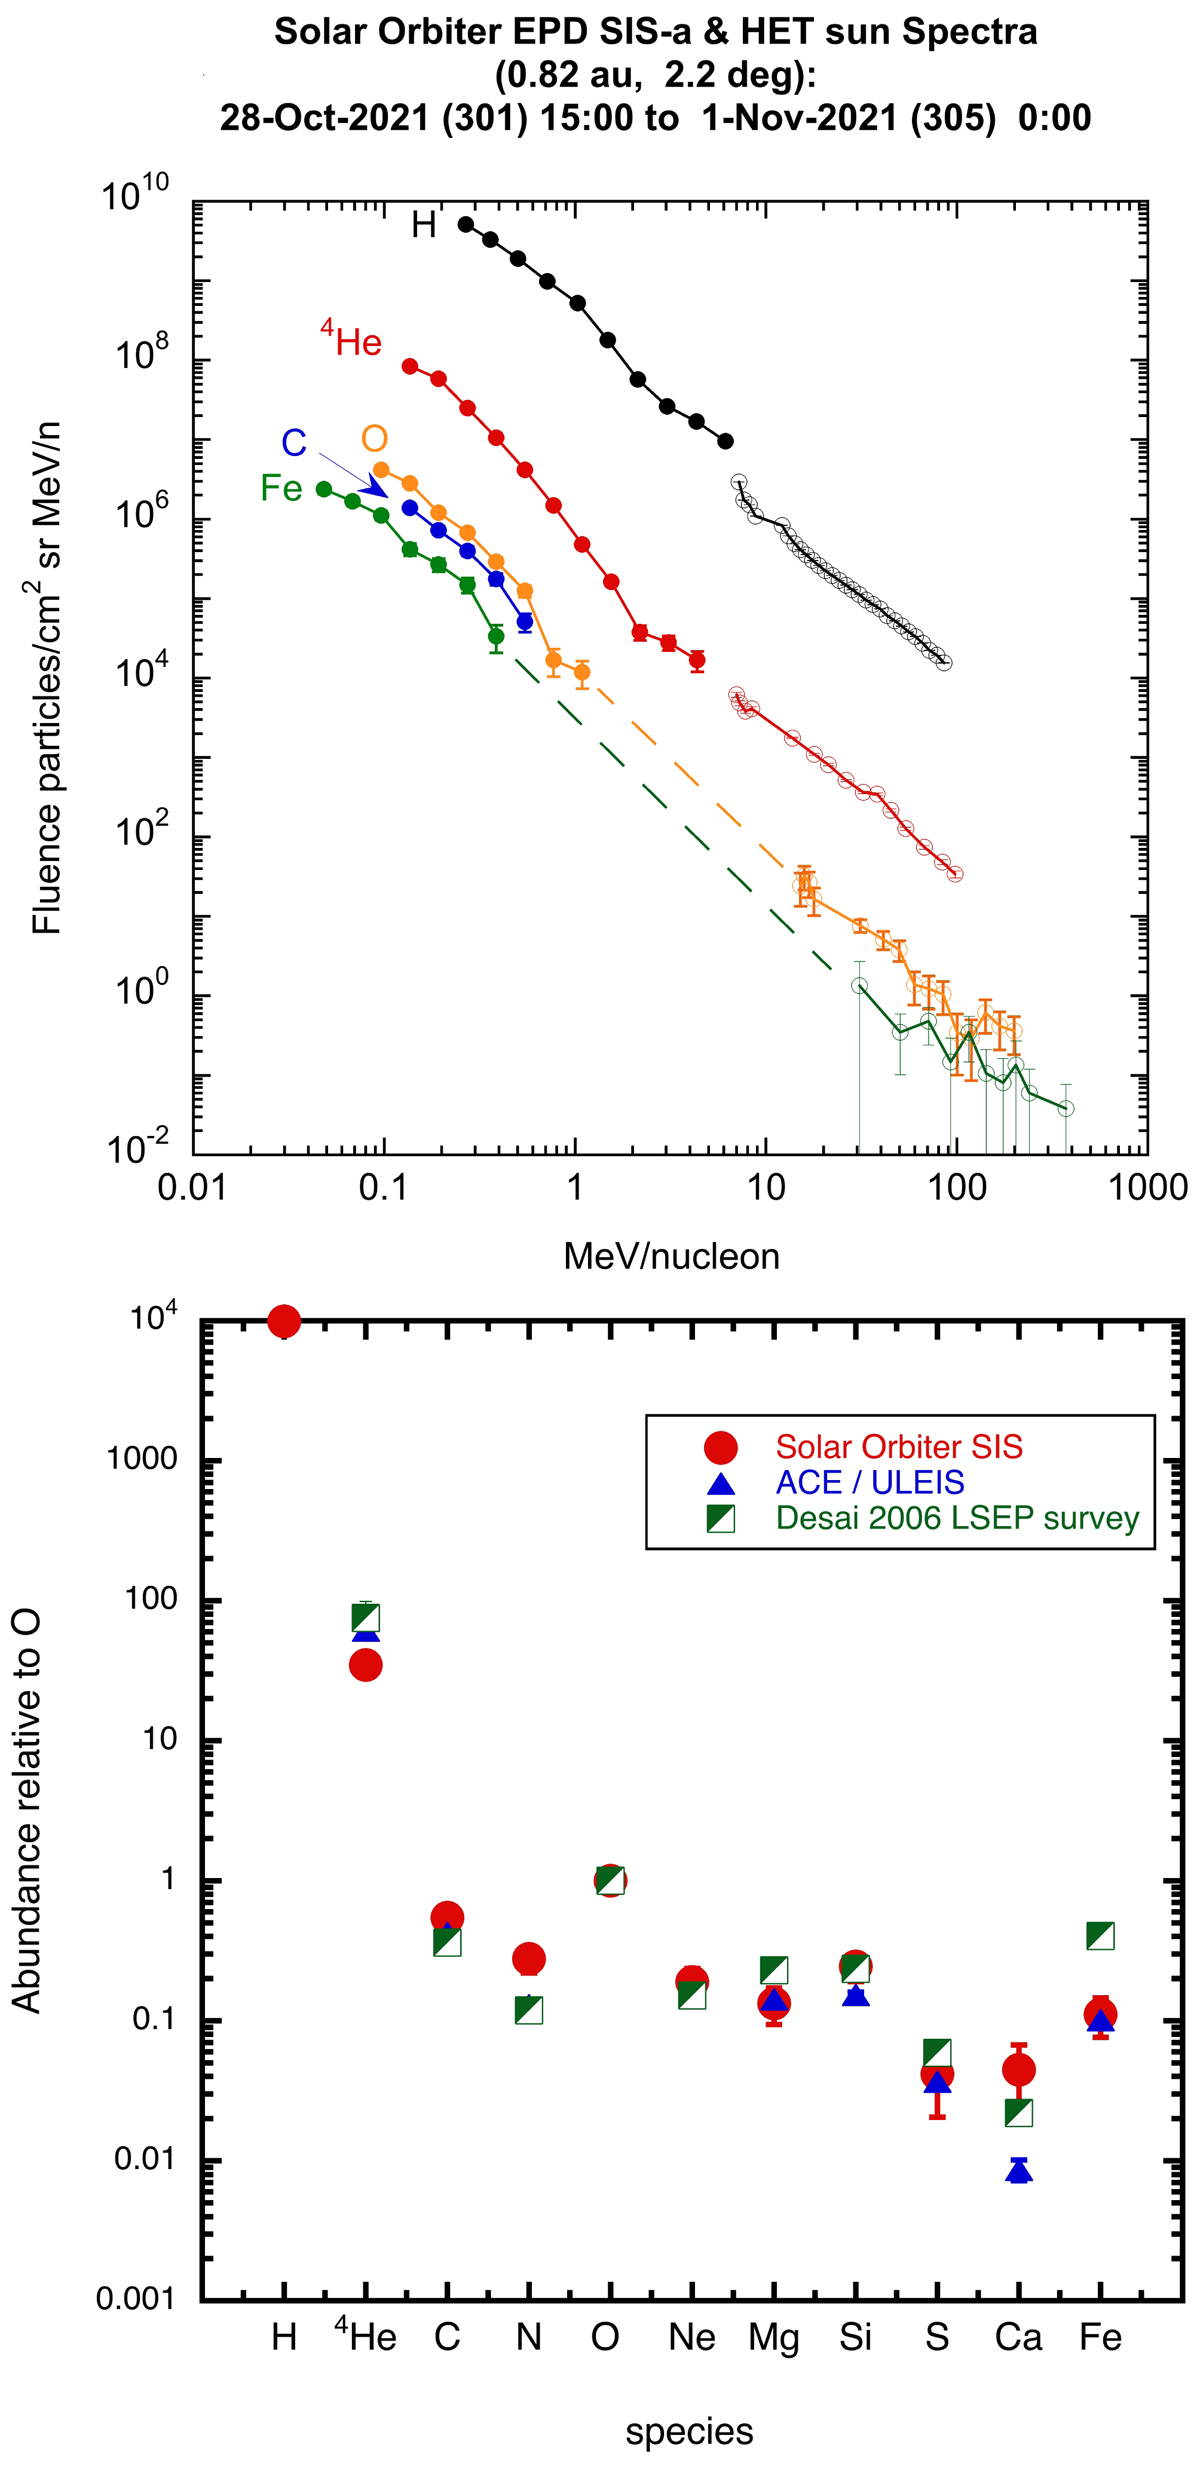
Fig. 8.
Download original image
Spectra and relative abundance over the entire event. Top: Differential fluence spectra for major species. The dashed lines connect gaps in instrumental energy coverage and are only to guide the eye. Bottom: Relative abundance of ions measured over the energy range 320–450 keV nucleon−1 from SOLO/SIS, ACE/ULEIS, and the survey of Desai et al. (2006).
Current usage metrics show cumulative count of Article Views (full-text article views including HTML views, PDF and ePub downloads, according to the available data) and Abstracts Views on Vision4Press platform.
Data correspond to usage on the plateform after 2015. The current usage metrics is available 48-96 hours after online publication and is updated daily on week days.
Initial download of the metrics may take a while.