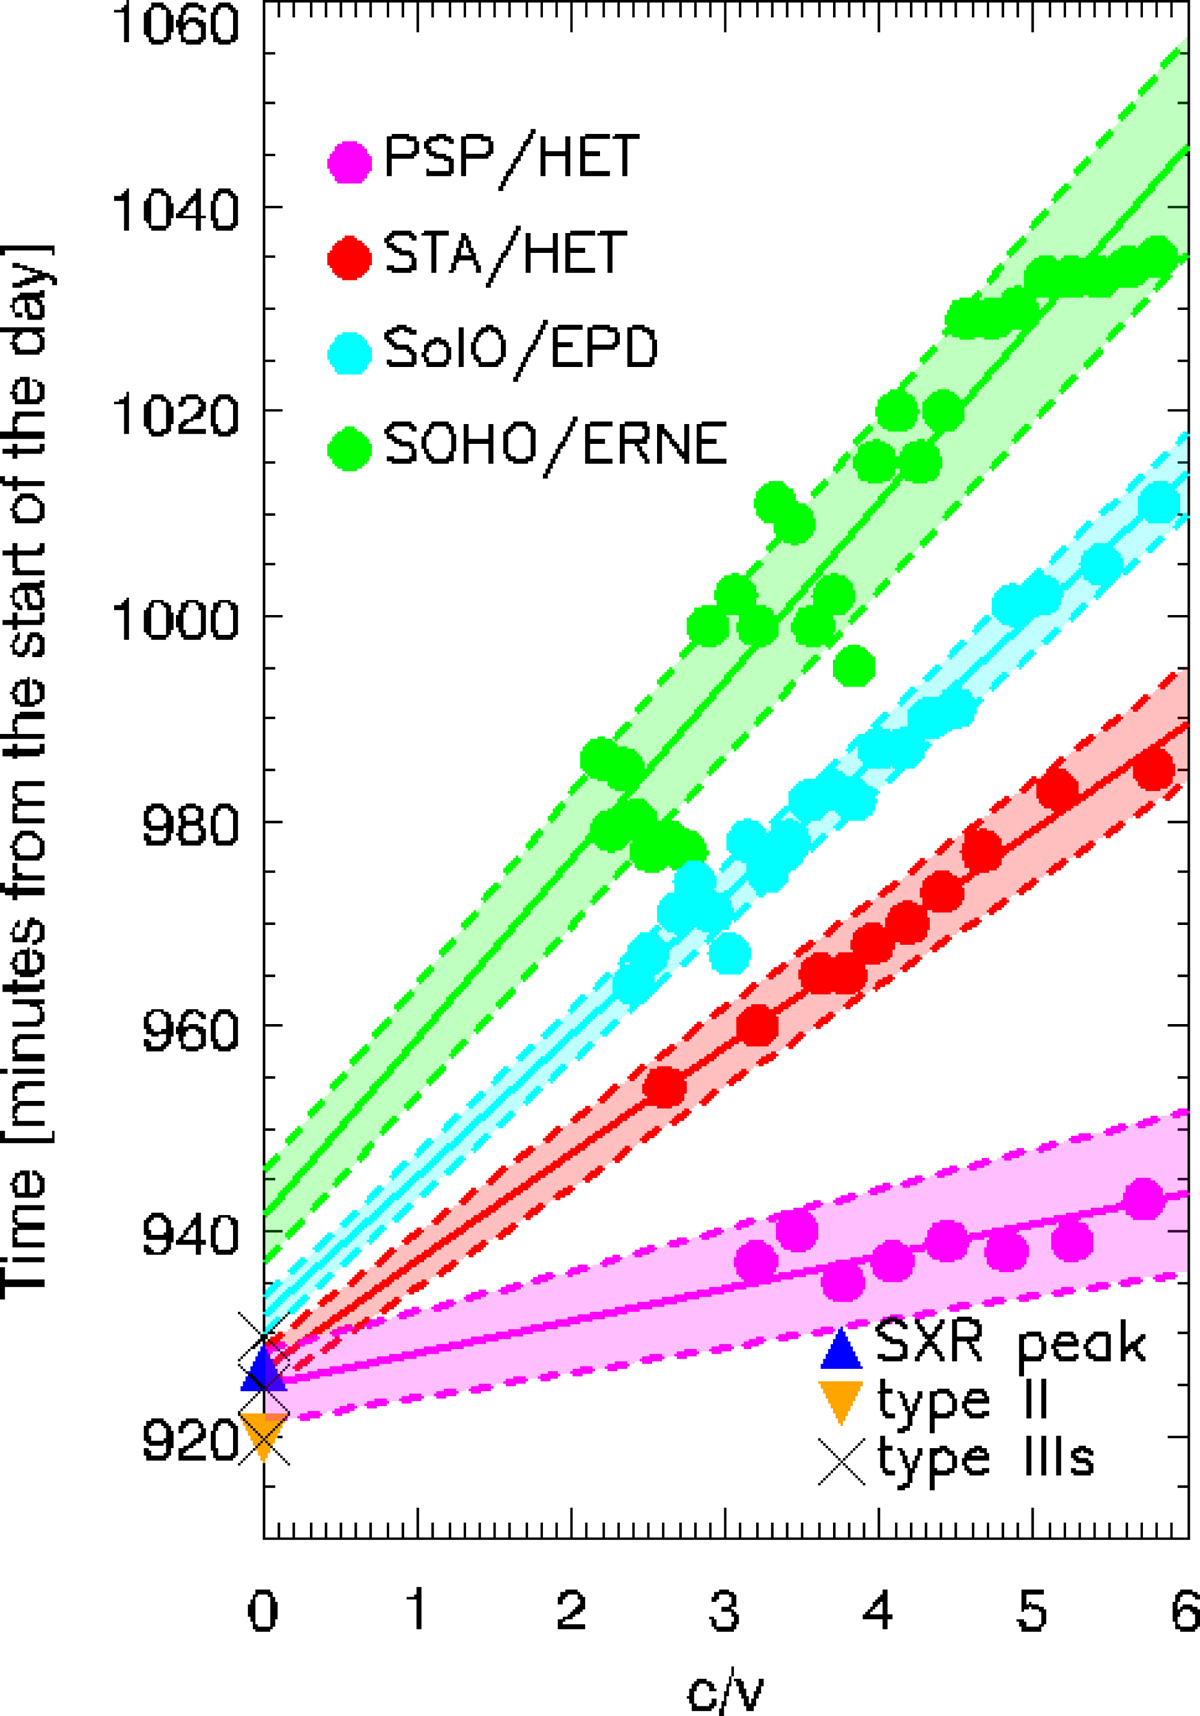
Fig. 6.
Download original image
VDA results for PSP/HET (magenta circles), STA/HET (red circles), SolO/EPD (cyan circles), and SOHO/ERNE (green circles). The lines depict the obtained linear fits, while the dotted lines and the corresponding shaded area with the same colouring represent the 1σ error per fit. The peak of the SXR flare is presented as a blue triangle, the type II burst at m-λ with a reverse orange triangle, while the three episodes of type III bursts are represented with a black X symbol. All solar eruptive signatures have been shifted; see text for details.
Current usage metrics show cumulative count of Article Views (full-text article views including HTML views, PDF and ePub downloads, according to the available data) and Abstracts Views on Vision4Press platform.
Data correspond to usage on the plateform after 2015. The current usage metrics is available 48-96 hours after online publication and is updated daily on week days.
Initial download of the metrics may take a while.